Where Fundamentals Meet Technicals: The Dark Side
 By
Lyn Alden
By
Lyn Alden
This is the latest edition of "Where Fundamentals Meet Technicals". Previous issues included charts from Zac or Garrett, while this particular issue includes charts from Harry.
Harry has a rather bearish potential setup in place for the markets. While we can never predict the future with perfect accuracy, the fundamentals do lend a lot of support to several of his troubling charts.
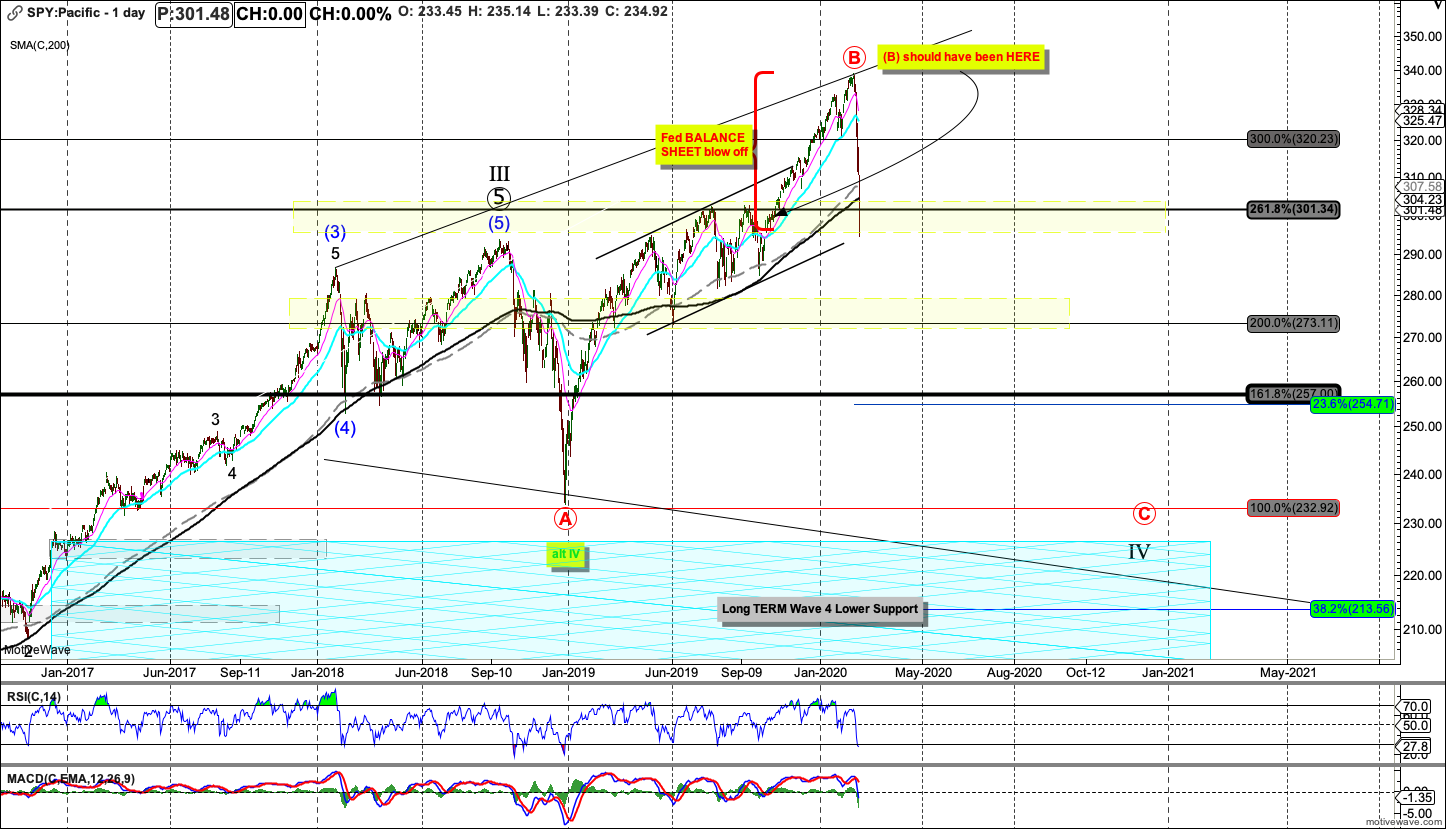
For starters, despite this recent sell-off, Harry has shown the potential final end to this correction as being noticeably lower than where we’ve already fallen to:
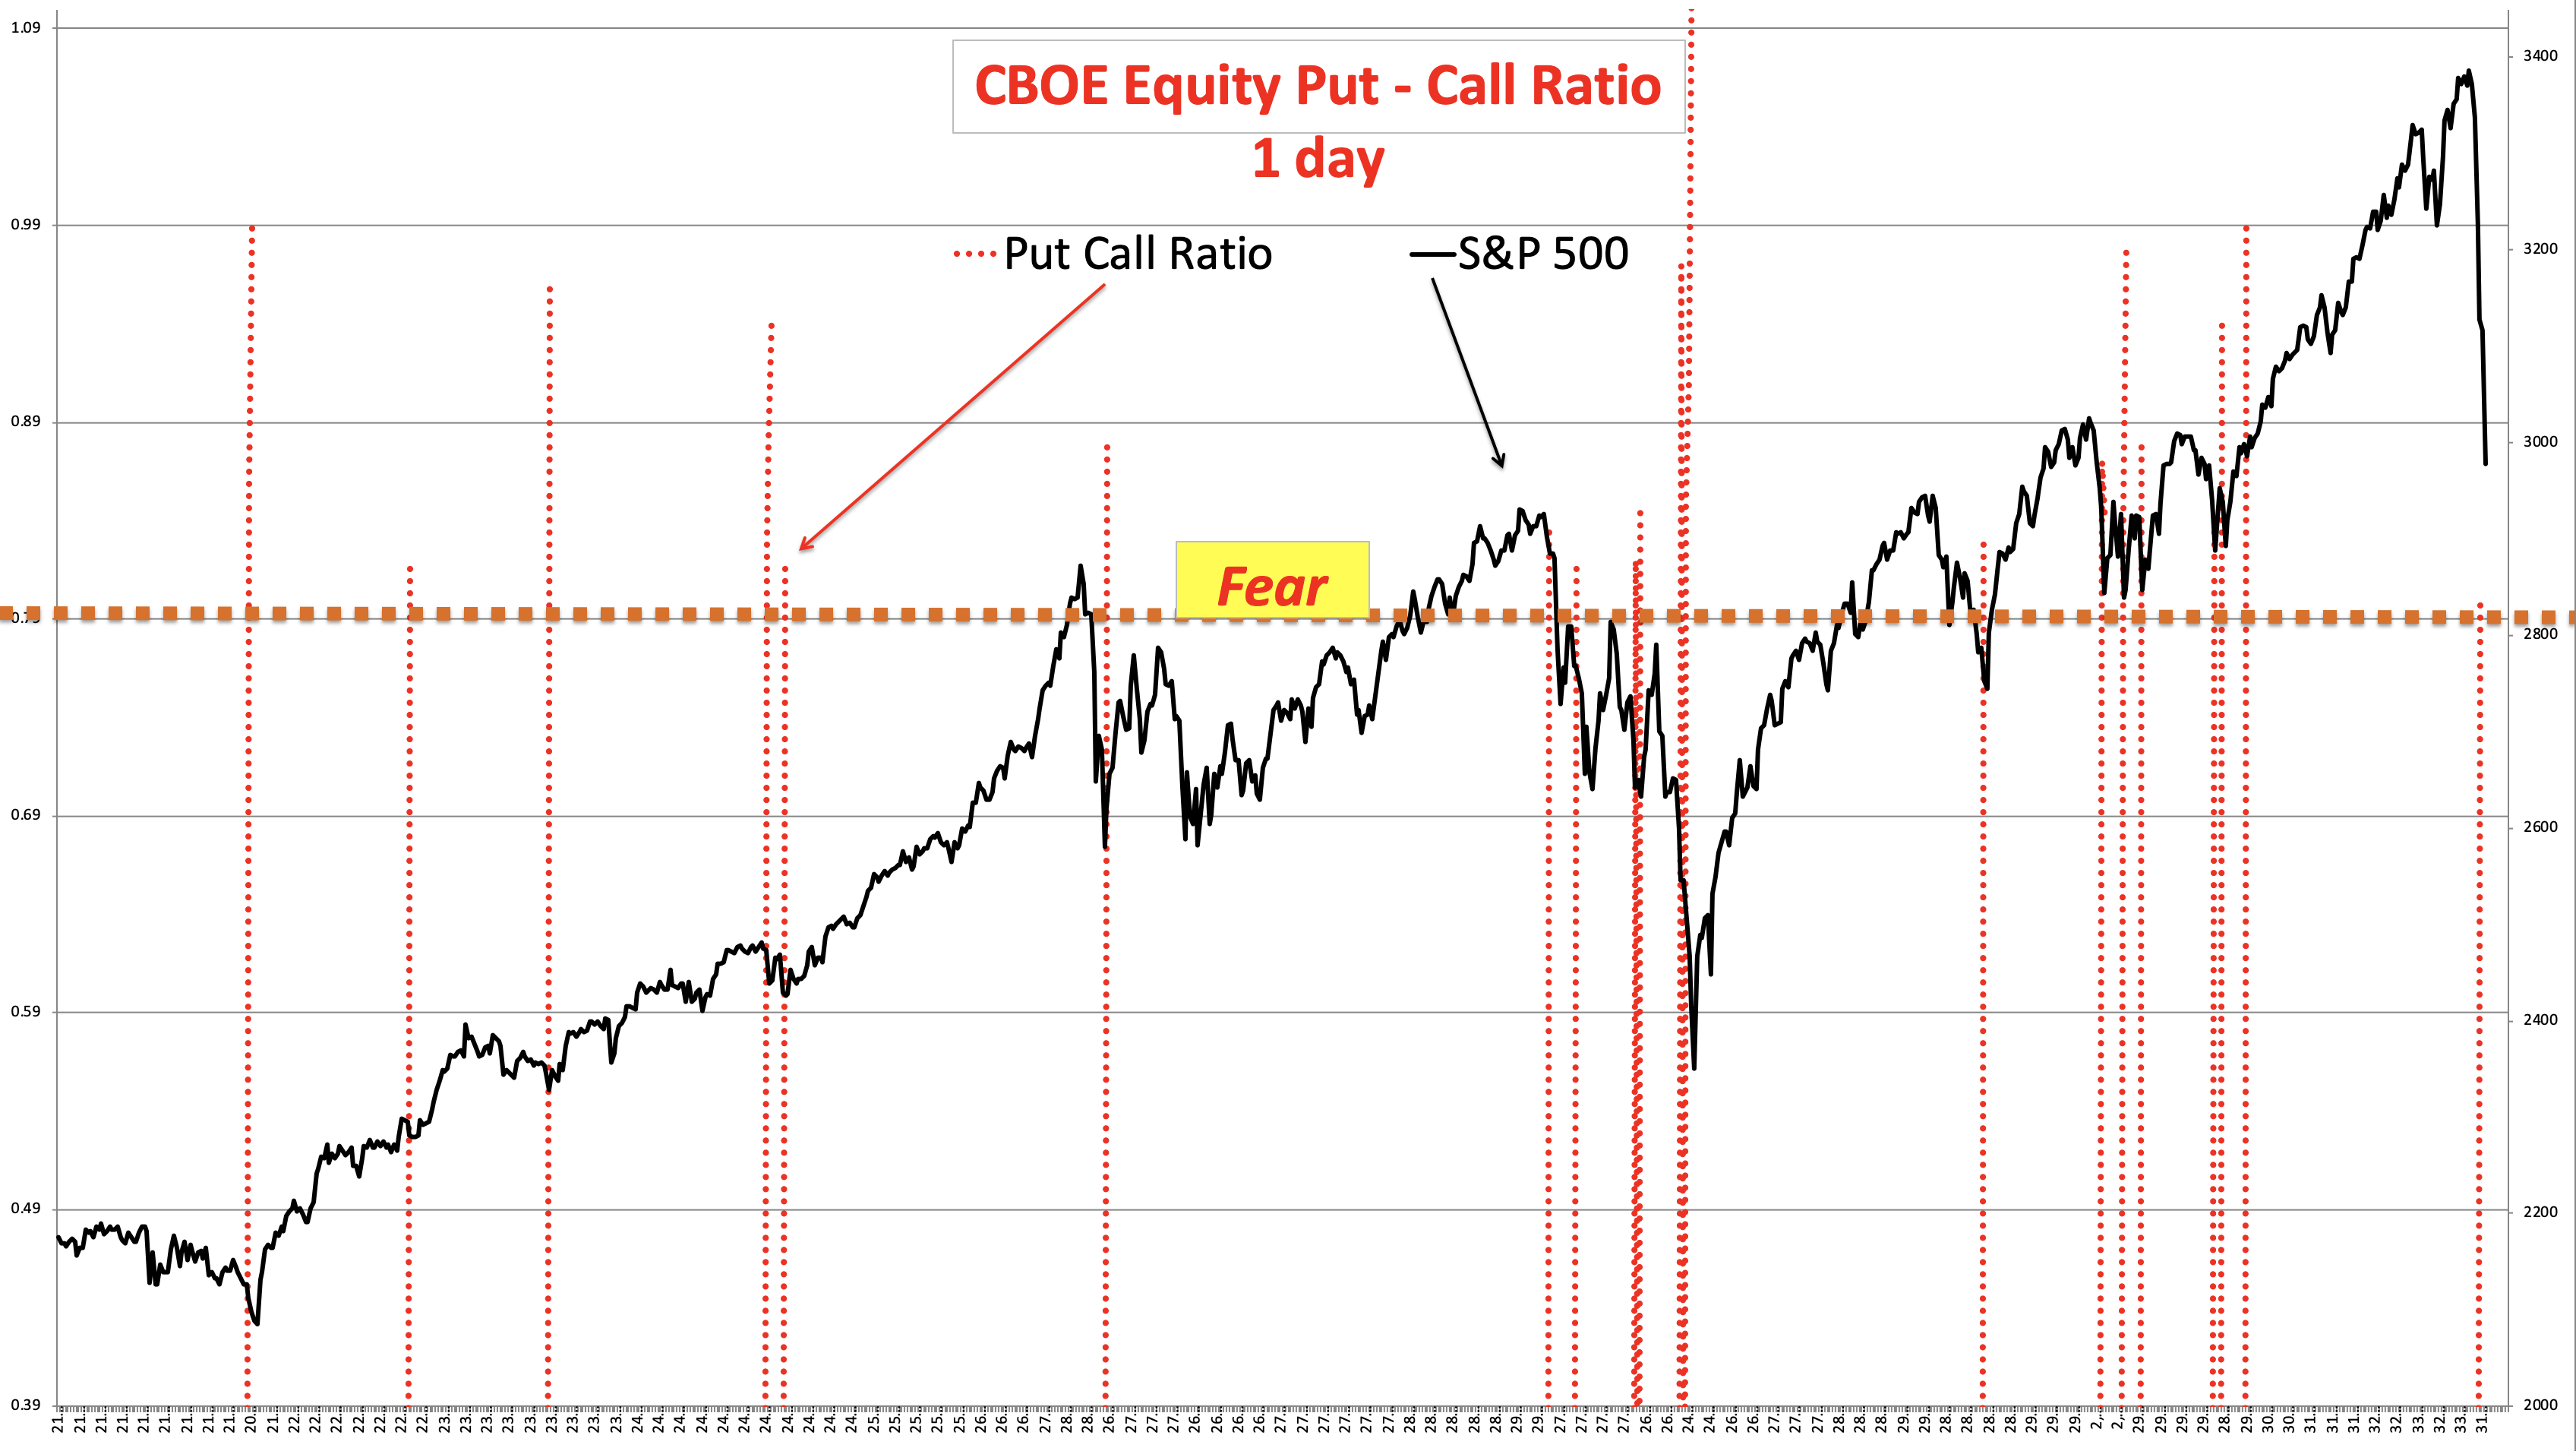
He also tracks options activity to see fear and complacency in the markets.
At the recent top, the market was extremely complacent, with an unusually low put to call ratio. Now, it’s starting to become more fearful on a one-day basis:
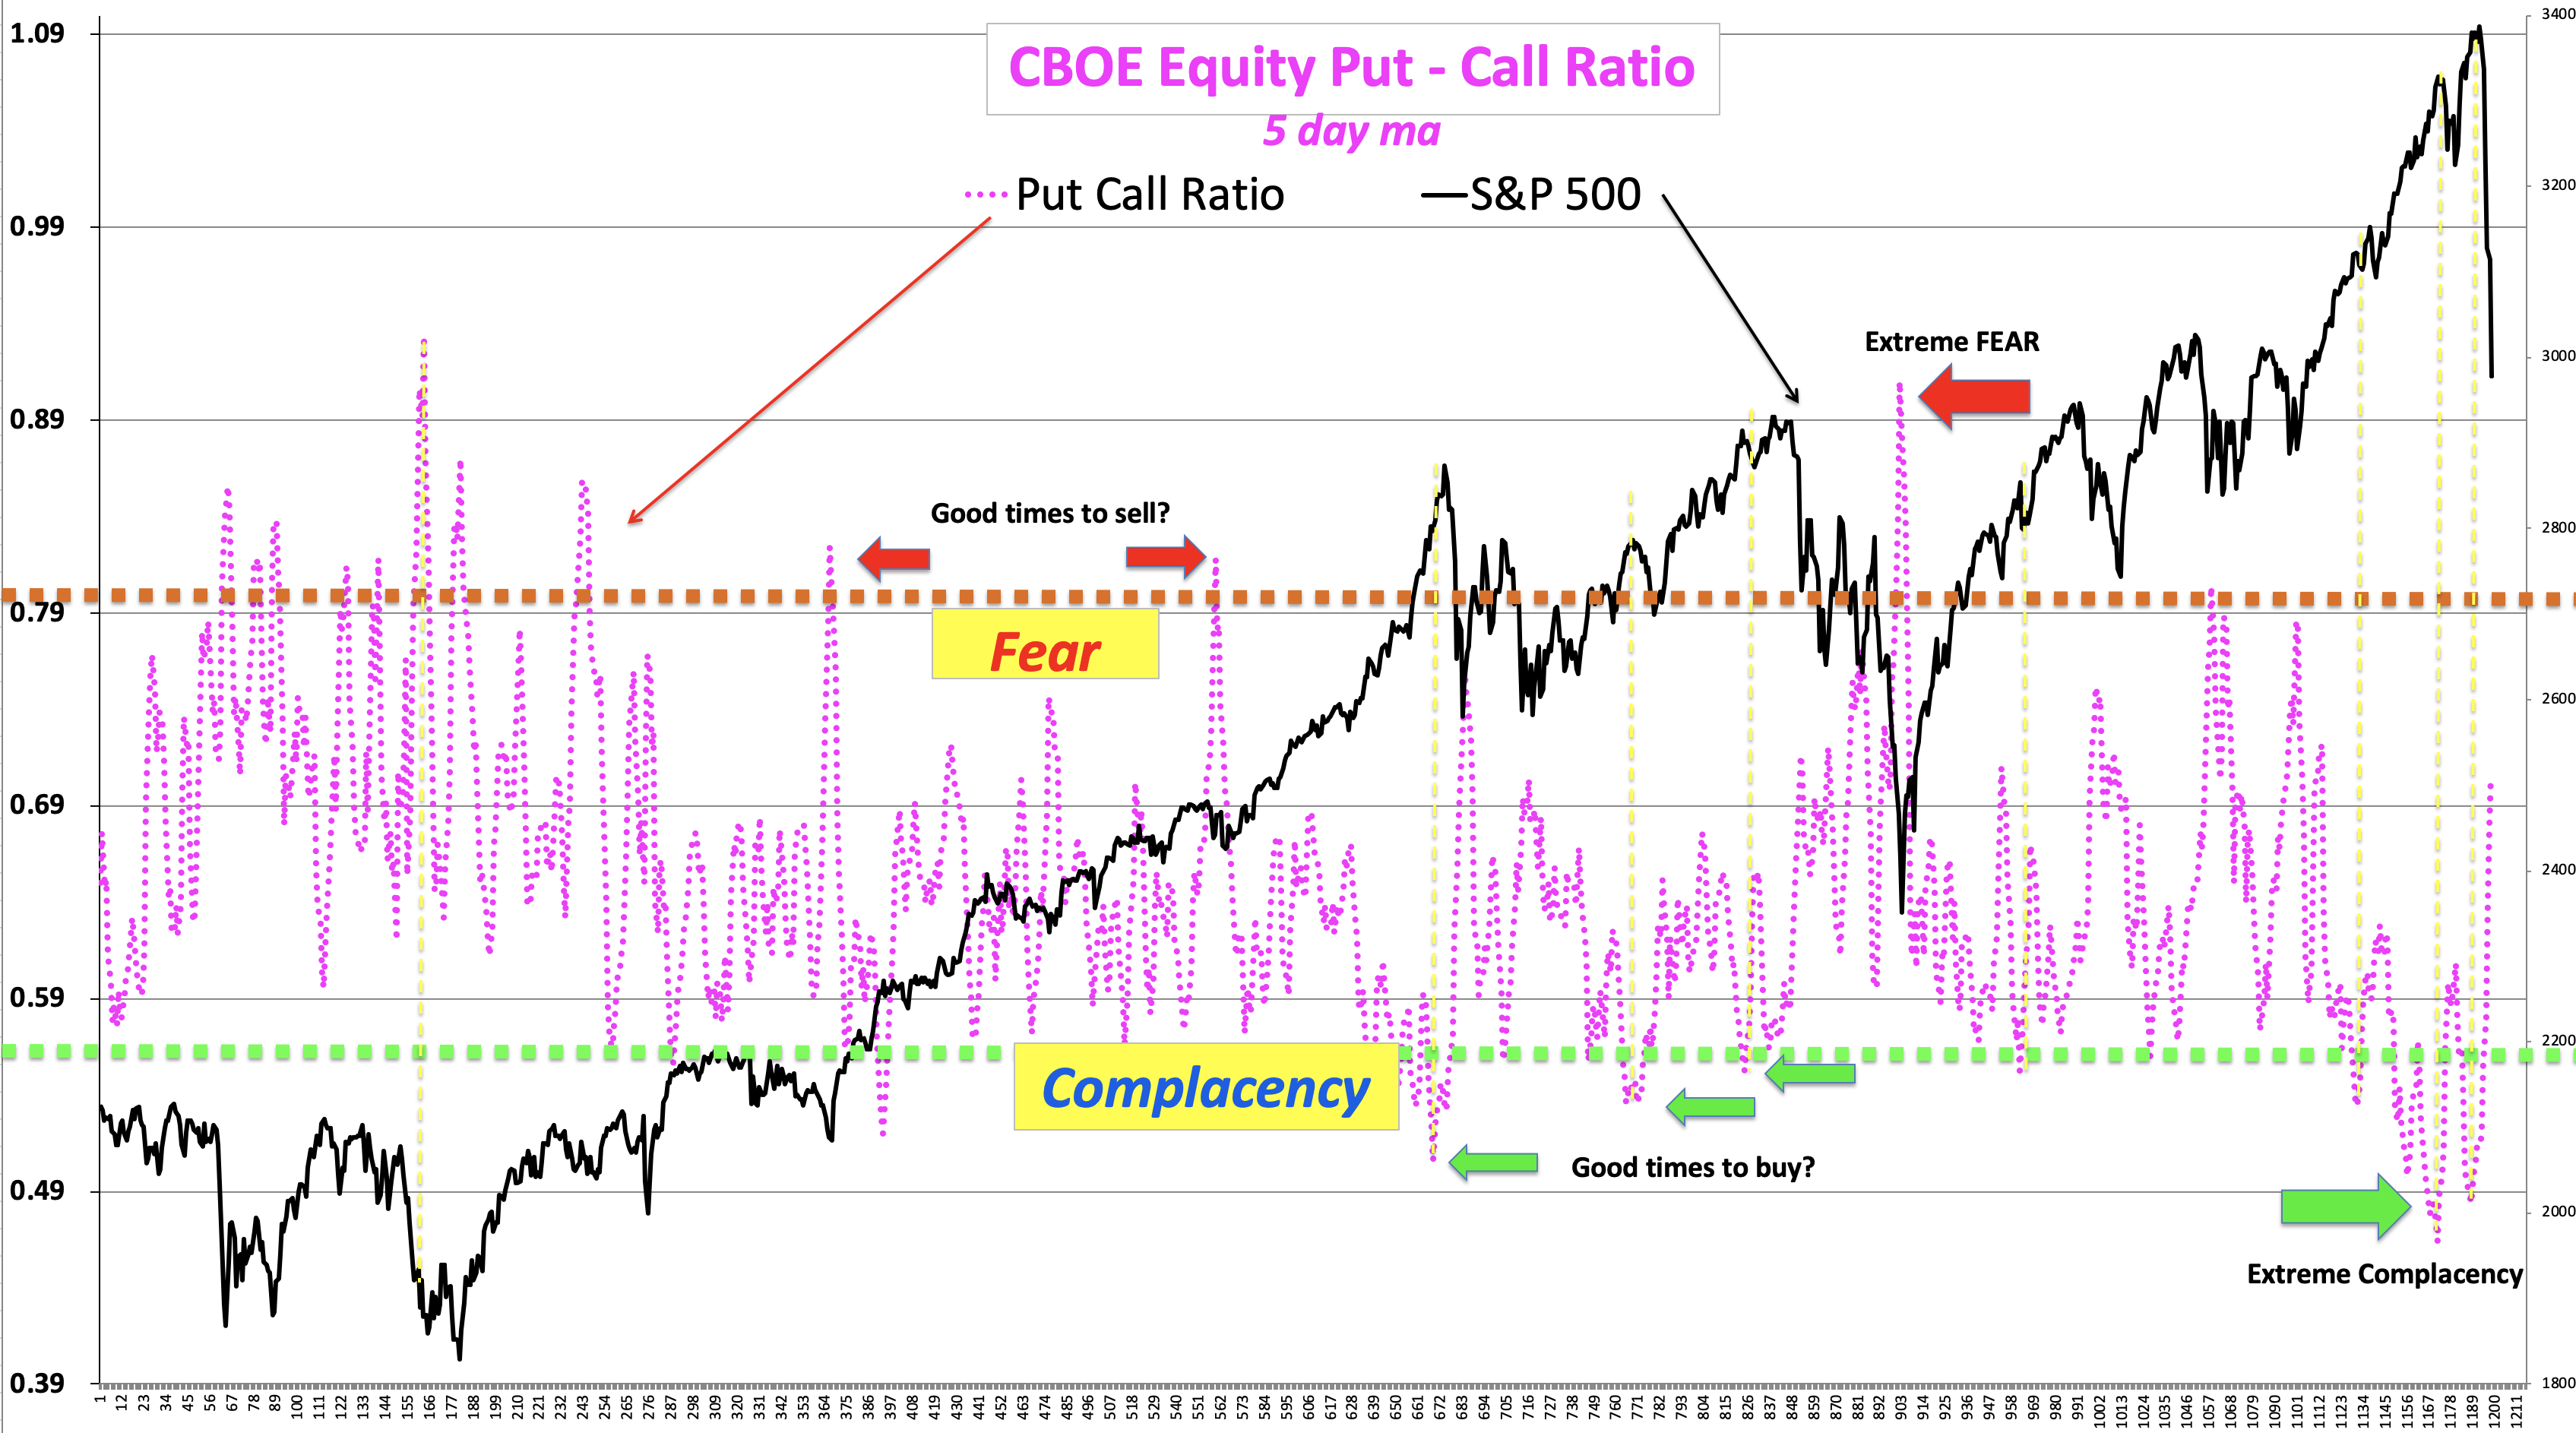
…but still only neutral on a 5-day moving average basis:
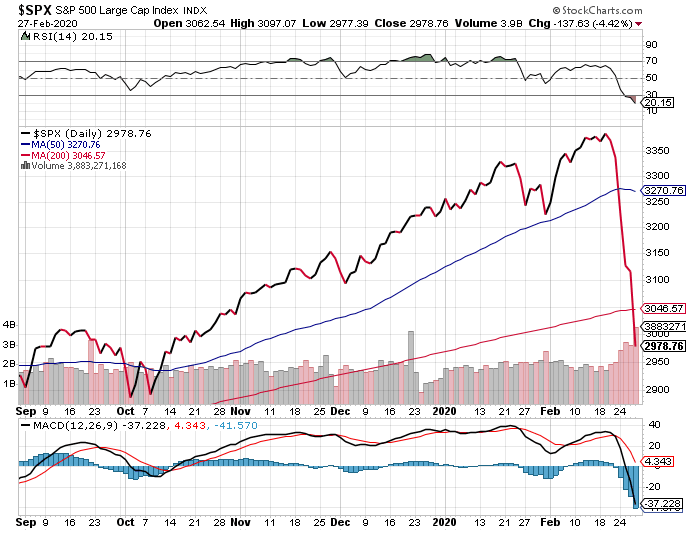
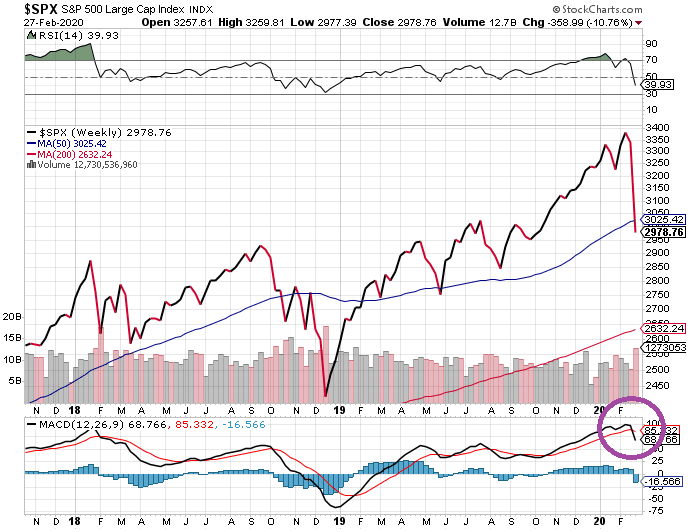
If we look at some of the basic technical charts, the S&P 500 is oversold in terms of RSI on the daily chart, indicating that we may get a bounce in the near future, as the majority of folks capitulate and dip buyers start to step in with force, after several recently-failed bounces:
However, on the weekly chart, we recently had a bearish MACD crossover from a high level. There’s plenty more room to fall technically when we push out the timeline weeks or months into the future:
If we step back and look fundamentally, valuations remain high, earnings expectations are being slashed due to virus-related supply chain issues, and we’re over a decade into a business cycle that is starting to show a lot of “toppy” indicators.
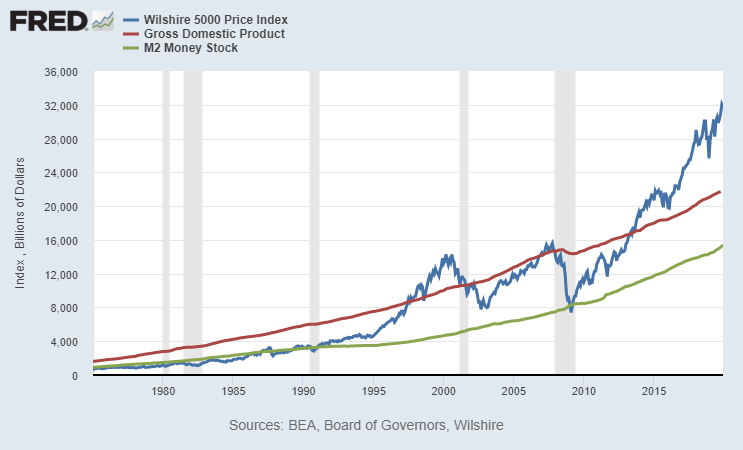
Here’s the classic “Buffett indicator”, which shows the total capitalization of the U.S. stock market (unfortunately a day out of date, but that’s not too significant at this scale) vs U.S. GDP. I also like to add the broad money supply in for an additional reference:
And here is total U.S. corporate profits vs total U.S. stock market capitalization, indexed to 100 in 1995.
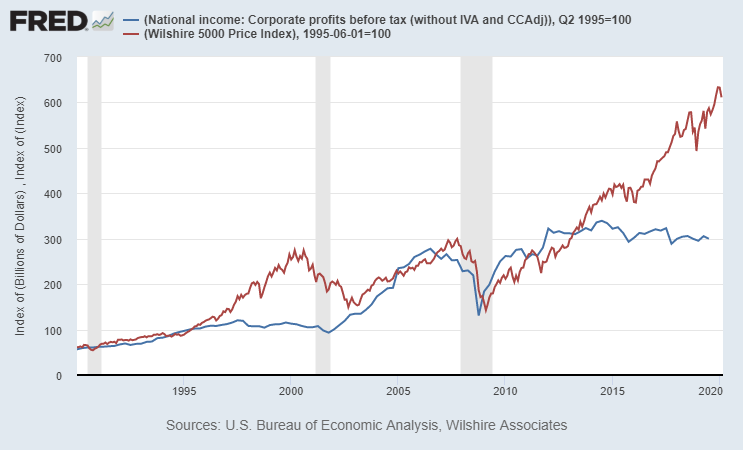
We’ve had “alligator jaws” form in recent years, where corporate profits flatlined, but equity prices continued to grow due to higher valuations, buybacks, tax cuts, and lower interest rates. Even a half-way slamming shut of these jaws would be a 20-25% decline from here.
Bear Market Volatility Goes Both Ways
The market just had its fastest-ever 10% correction from all-time highs. Literally in a near-century of data, this is the fastest. There have been faster 10% drawdowns in the past (including more than double that figure in one famous day in 1987), but not right from all-time highs.
An un-intuitive fact is that the market’s biggest historical “up” days tend to occur in bear markets. You might think that the biggest down days occur in bear markets while the biggest up days occur in bull markets, but that would be incorrect.
Bull markets are generally characterized by lower volatility, with stocks grinding higher, and making new highs a fraction of a percent each day. Bear markets, on the other hand, have higher volatility, and that includes both the upside and downside. They have big daily drawdowns, but also big bounce attempts when folks try to buy the oversold dip. An investor can never be sure; sometimes those big spikes up are the start of a “V-shaped recovery”, while other times they are bull traps, enticing investors to buy the dip just before falling to new lows.
So, more likely than not, we’ll get some big “up” days in the weeks ahead. However, in the grand scheme of things, there is plenty of risk in stock prices at the moment. We’ll need to monitor the market fundamentally and technically to find the highest probability setups as things develop.
Mega-cap stocks remain expensive compared to their previously-estimated forward earnings, and those forward earnings are now being slashed lower.
Microsoft (MSFT), for example, is still trading at a blended P/E of nearly 30, and it has already said it probably won’t meet those 2020 targets, because it can’t sell Windows for PCs that can’t be made due to Chinese supply chain disruptions:
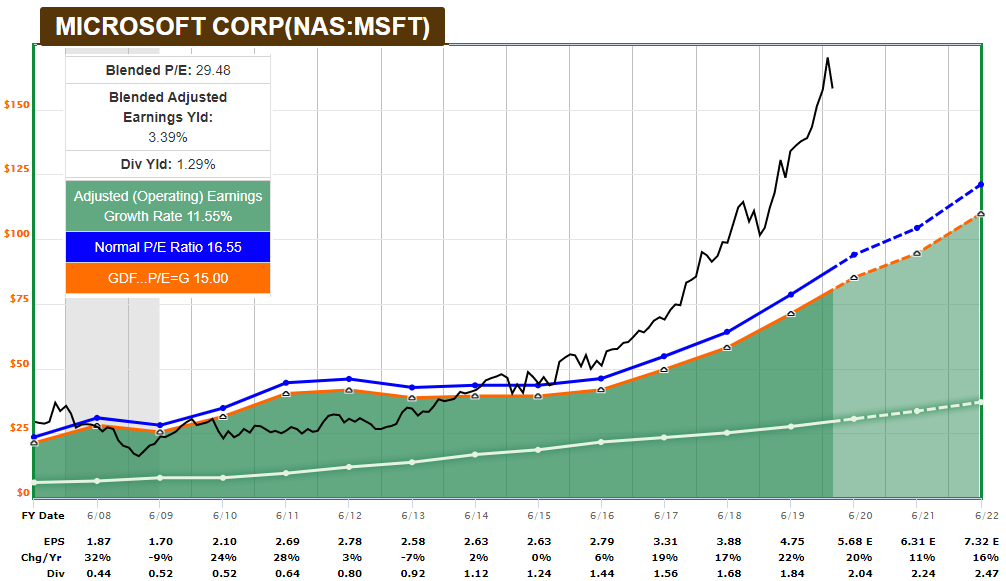
Source: F.A.S.T. Graphs
Similarly, Apple (AAPL) had a big correction recently, but is still trading well above its recent valuation average, despite the fact that their product supply chain is heavily disrupted, and they said they’ll miss guidance as well:
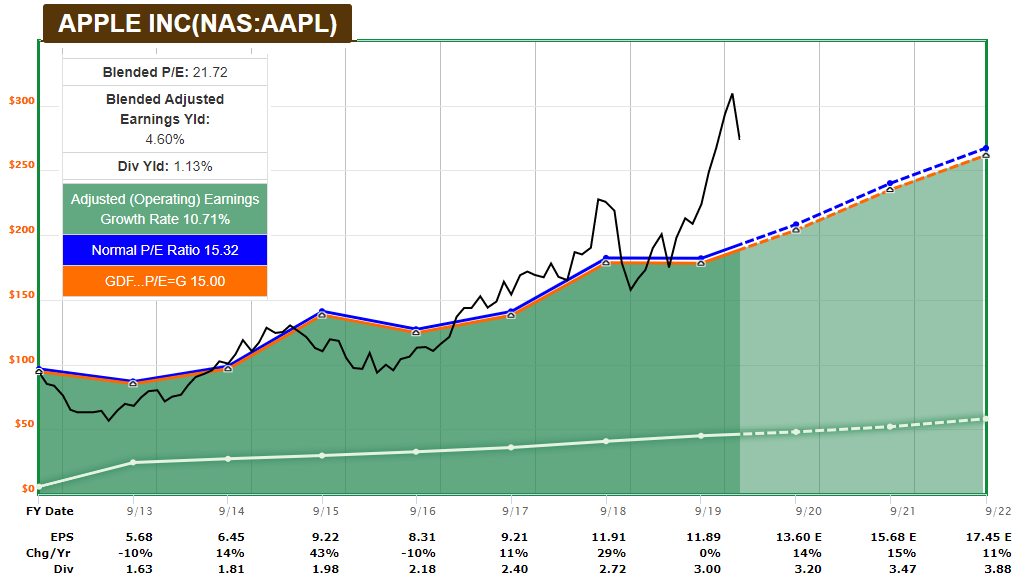
Source: F.A.S.T. Graphs
Even companies that you’d expect to be minimally impacted, like Mastercard (MA), are cutting guidance. Mastercard recently shaved 2-3% off of its guidance, which is unfortunate because the stock was already rather expensive even compared to its previous consensus expectations:
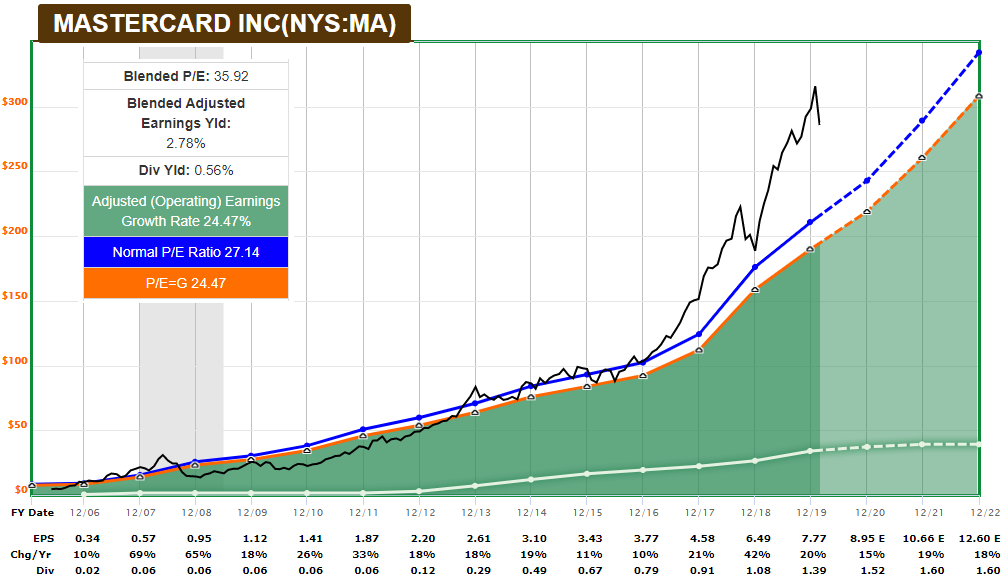
Source: F.A.S.T. Graphs
Final Thoughts
The market never goes up or down in a straight line. Dips occur during bull markets, and bounces occur during bear markets.
When stocks become oversold on a near-term basis, remember that even if they bounce, they could still have considerably further to fall in terms of fundamentals and valuations over the coming months, even without a worst-case scenario playing out.
Harry’s potential technicals make a lot of sense fundamentally in the current environment.
In a no-recession scenario, several stocks could simply let out a lot of steam, and become more attractive buying opportunities from a fundamental perspective once again.
However, the market has the additional risk of an early-stage recession forming. Employment has already been showing some “toppy” indications in the past year, and the recent virus-related supply chain disruptions are an additional catalyst to accelerate the issue.
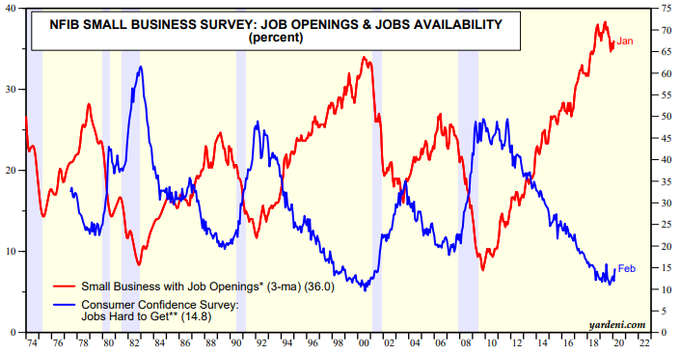
Chart Source: Yardeni
Investors should manage risk in relation to the upside and downside potentials. This recent sell-off may present a large number of buying opportunities, but some of the core indices (and most of the stocks within them) may still have considerable room to fall before this is over, even if it may not be in a continued straight line.
