Where Fundamentals Meet Technicals: Facebook and Barrick
 By
Lyn Alden
By
Lyn Alden
Each week for Stock Waves, I write a piece that analyzes stocks for which the fundamentals and technicals are both pointing in the same direction, bullish or bearish.
Occasionally, I make one of them public, like this one.
This week’s issue of “Where Fundamentals Meet Technicals” focuses on Facebook (FB) and Barrick Gold (GOLD).
Facebook has been one of my stock selections in recent months that I continue to monitor pretty closely, and they just had a blowout quarter.
Revenue and earnings came in way above expectations, and their planned capex for 2021 is projected to be $2 billion lower than they previously forecast. So, the company is a free cash flow machine right now.
Their daily active users and monthly active users came in slightly light of expectations, however. In fact, their US and Canadian segment has been rather flat for more than a year as they’ve seemingly reached market saturation:
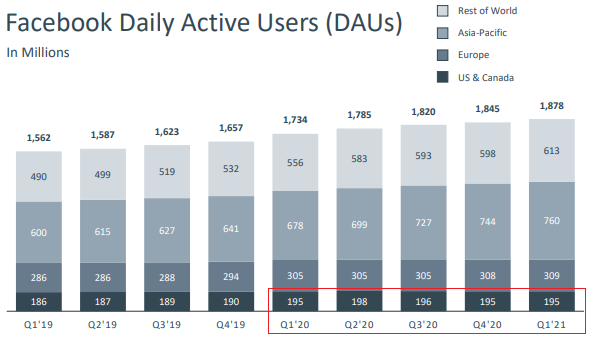
Chart Source: Facebook Q1 2021 Earnings Presentation
Facebook’s great numbers came from a rebound in ad spending, rather than strong user growth.
I view the company as a long-term curated emerging market play. North America and Europe represent the minority of their users but the vast majority of their revenue, because those are the areas with a lot of spending power. As per-capita income grows in emerging markets over the next decade, however, Facebook has plenty of upside from them even without much user growth from this high level.
Facebook has $64 billion in cash equivalents and no debt, other than a small bit of capital lease liabilities, which gives them one of the strongest balance sheets in the world.
From a fundamental perspective, Facebook is a good “growth at a reasonable price” stock, with a reasonably attractive price/earnings/growth “PEG” ratio:
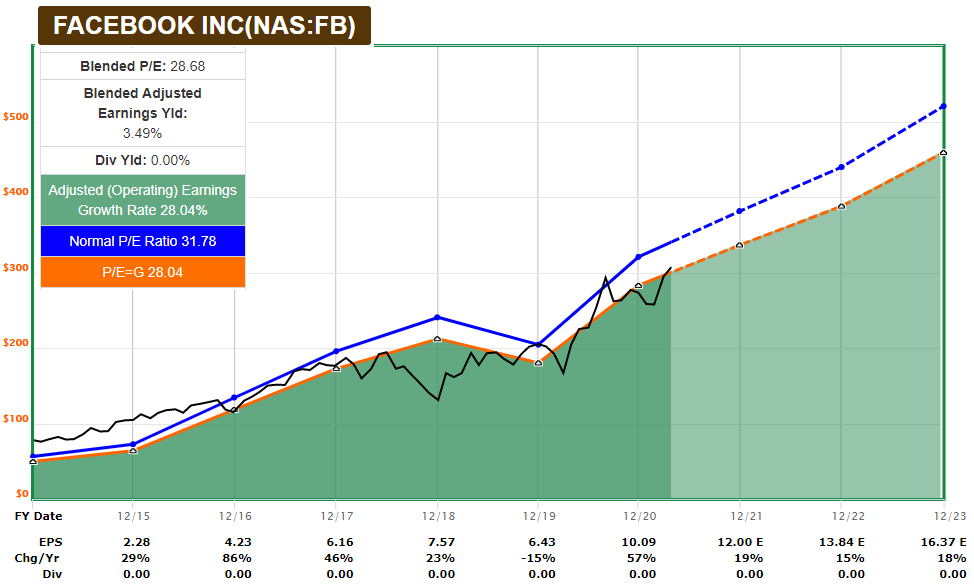
Chart Source: F.A.S.T. Graphs
From a technical perspective, the stock had a positive MACD crossover on the weekly chart in March 2021, for the first time since back in April 2020:
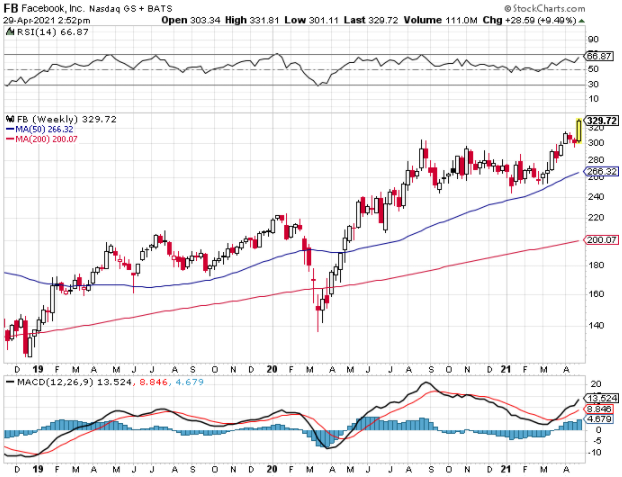
Garrett’s technical analysis suggests a choppy bull trend still ahead:
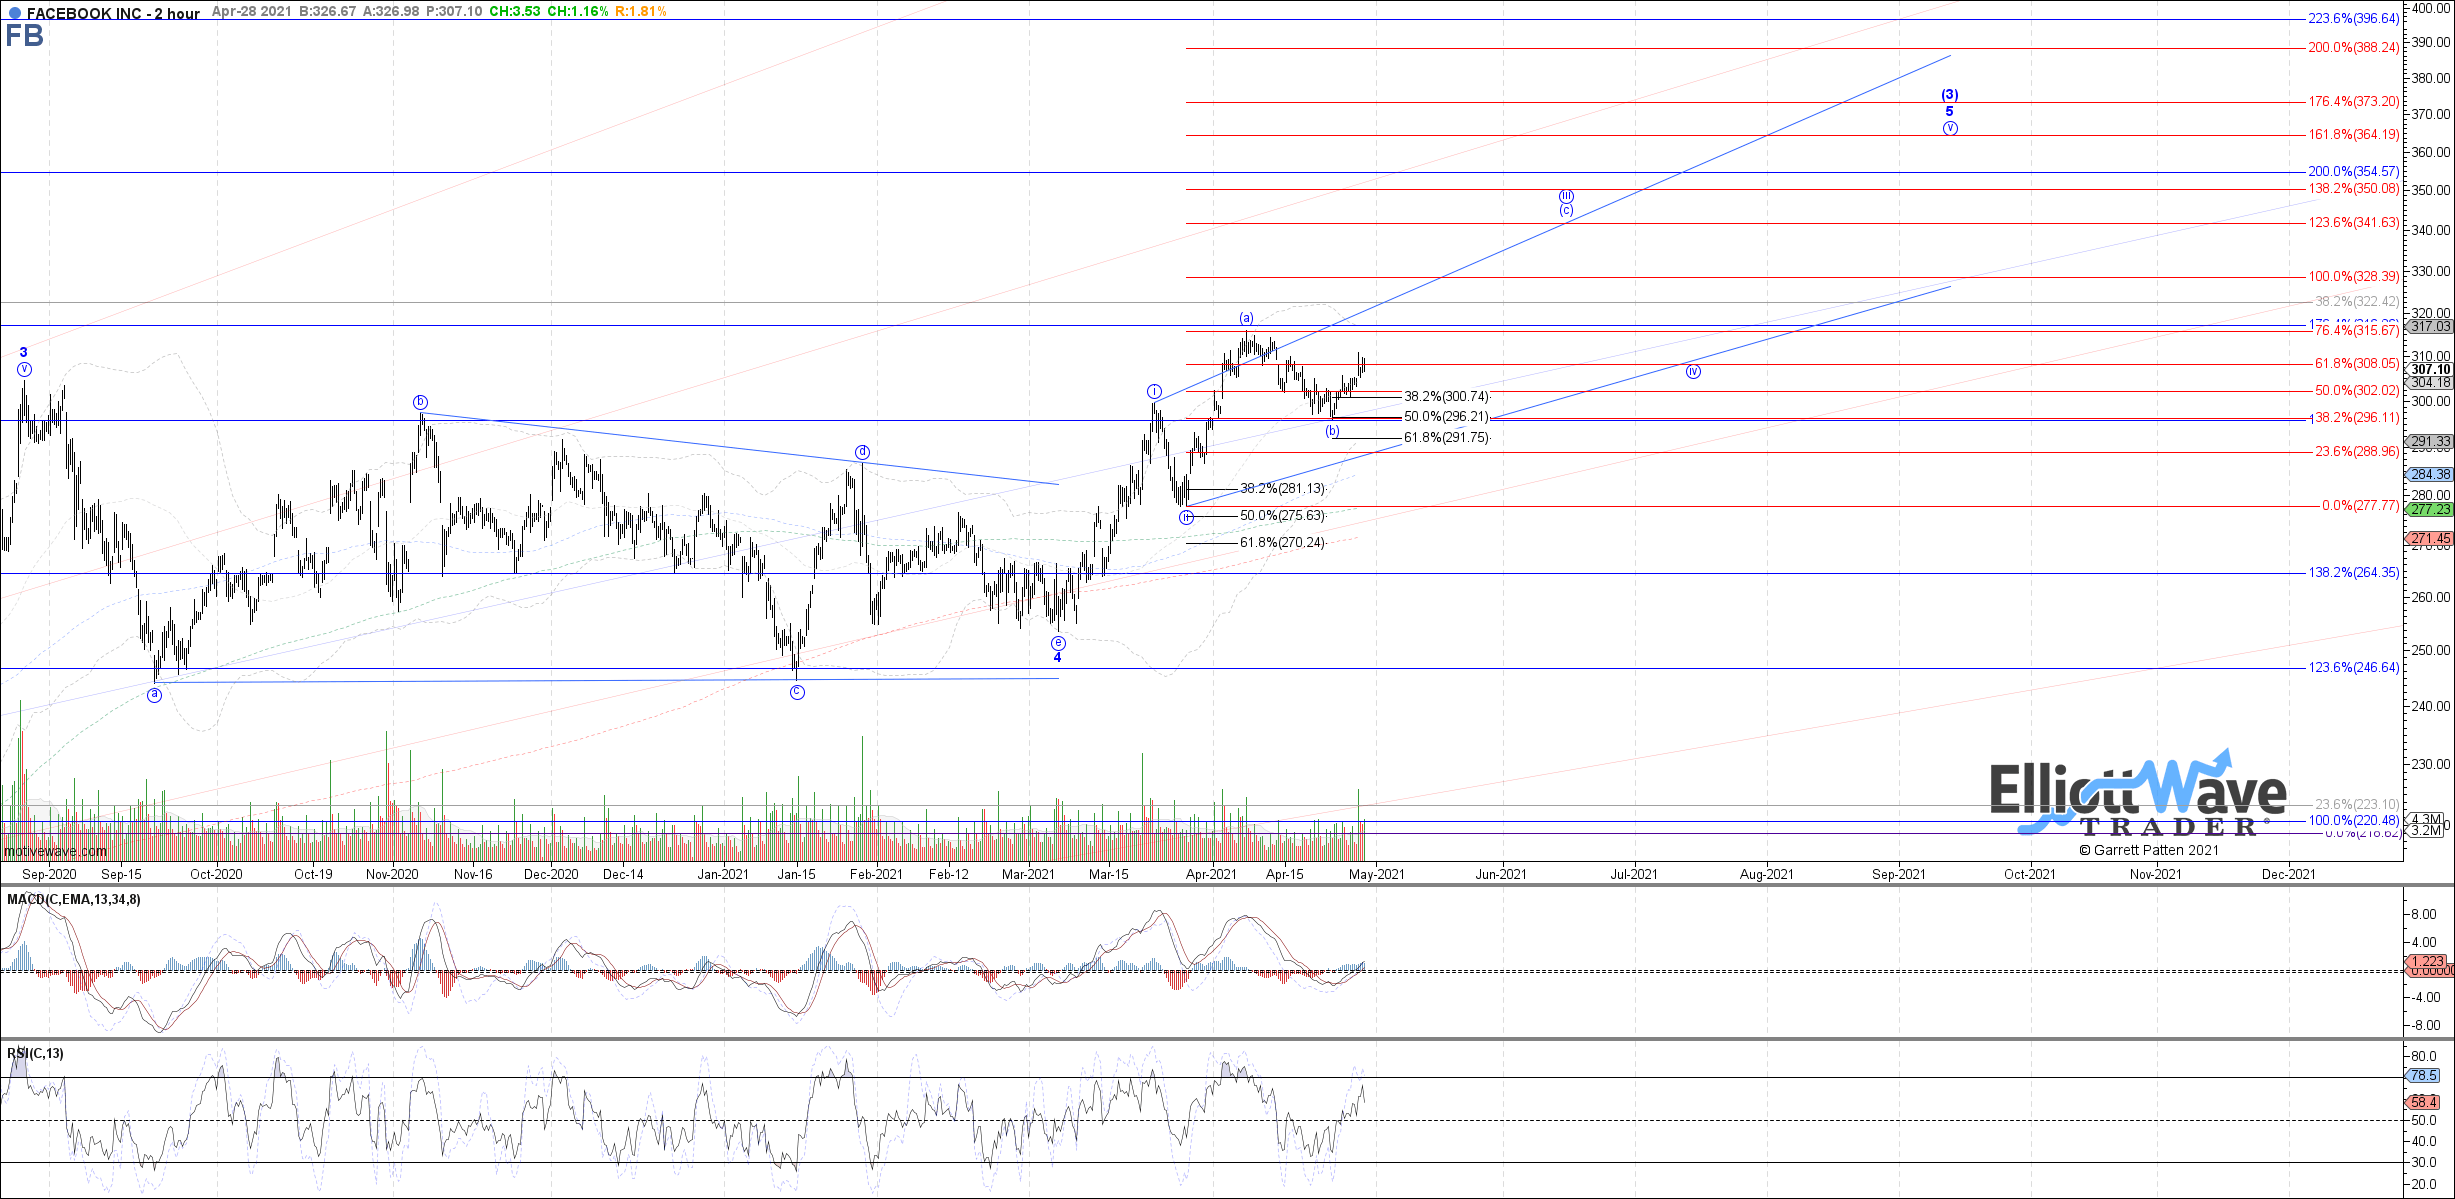
Overall, Facebook remains a stock that I like as part of a diversified portfolio. It has solid growth, a reasonable valuation thanks to plenty of regulatory risks that keep it from being too consensus, a strong balance sheet, and plenty of upside potential from global markets.
Barrick Gold
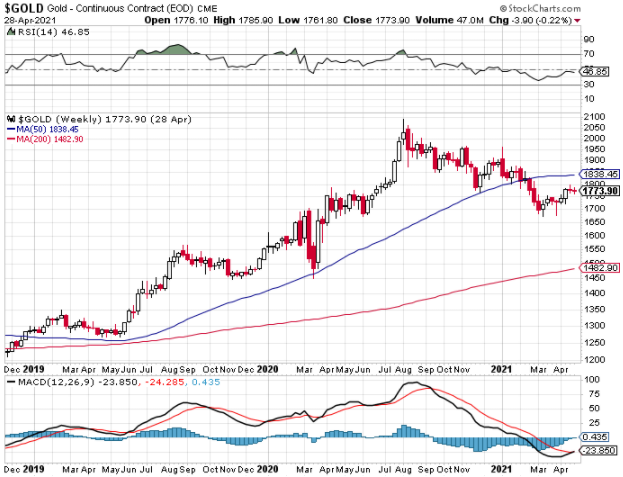
The gold market has been in a correction since August 2020, although momentum has been shifting back in its favor more recently since March 2021.
Gold’s closest correlation is with long-term real Treasury rates, meaning the nominal Treasury yield minus the prevailing inflation rate. When real interest rates are headed higher, it usually puts downward pressure on gold, and when real rates are headed lower, usually gold does well.
Lately, nominal yields have been consolidating while inflation continues to pick up, which has reduced real yields and helped gold find a local bottom.
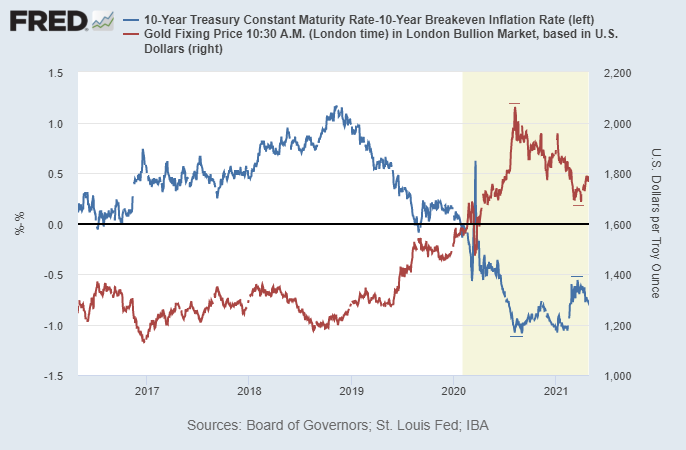
Chart Source: St. Louis Fed
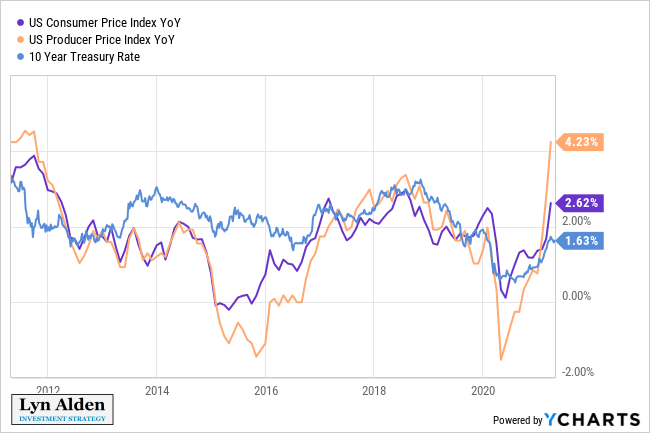
As we look forward, easy year-over-year base effects for the April-through-June period (reported May through July), combined with ongoing effects from fiscal stimulus, are pointing towards some rather high consumer price inflation prints.
March already saw some hot numbers, and the April/May/June period will almost certainly be higher:
Andreas Steno Larsen (global chief strategist at Nordea, the largest financial group in northern Europe) and Mikael Sarwe (head of Nordea market strategy) have been putting out some charts about inflation correlations recently. Here’s Sarwe’s hottest chart, showing the combination that low base effects and reflationary policy could have on year-over-year numbers:
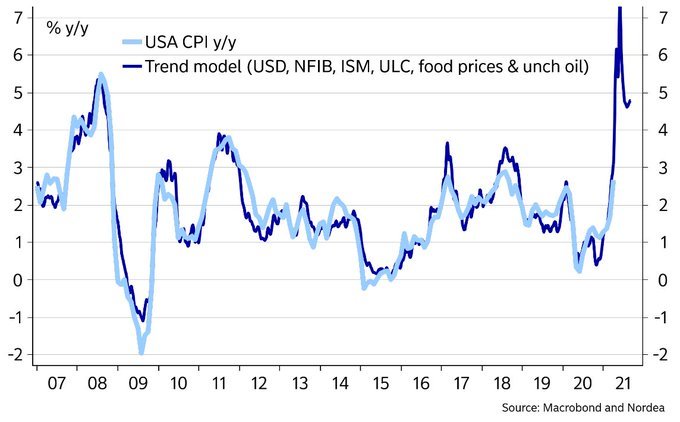
Chart Source: @mikaelsarwe
Basically, inflation should run relatively hot for a few months here at least, and the Treasury market is generally unable to move that quickly. My base case, therefore, is for lower real yields as we move into late spring and early summer, which should be supportive of the gold market.
The gold price just had a positive MACD crossover on the weekly chart here in April 2021.
Back during the 2011 gold bull market, the gold mining industry still didn’t make much in the way of free cash flow. They had high expenses from high energy costs, and they plowed money into a lot of bad projects. The subsequent multi-year bear market put a ton of pressure on the industry, and destroyed a lot of capital.
Since the bull market re-appeared at the start of 2016, gold miners have been a lot more disciplined this time around. Expenses are staying low, and gold miners are taking their free cash flow and using it to strengthen their balance sheets and pay reliable dividends, rather than aggressively do capex or acquisitions.
Barrick, being one of the world’s largest gold miners, is a key company to follow in the industry. They came under new management in recent years, and have done very well since then.
This chart shows Barrick’s cash equivalents, long-term debt, and net long-term debt over the past two decades:
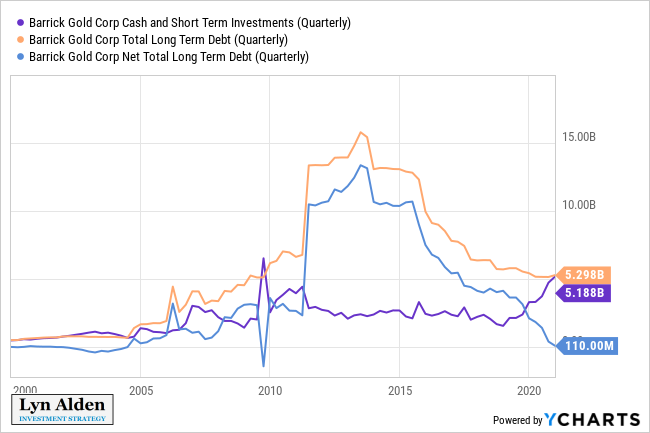
As you can see, the company had a ton of leverage from 2011-2015. Then they began paying down debt, and over the past year, they retained a ton of cash (maybe planning an acquisition?). In fact, they have almost as much cash as debt, so the net debt keeps going lower and is near zero, which is great.
If we look at the free cash flow version of the F.A.S.T. Graph for the company, they’ve never been as consistently focused on generating free cash flow as they are now:
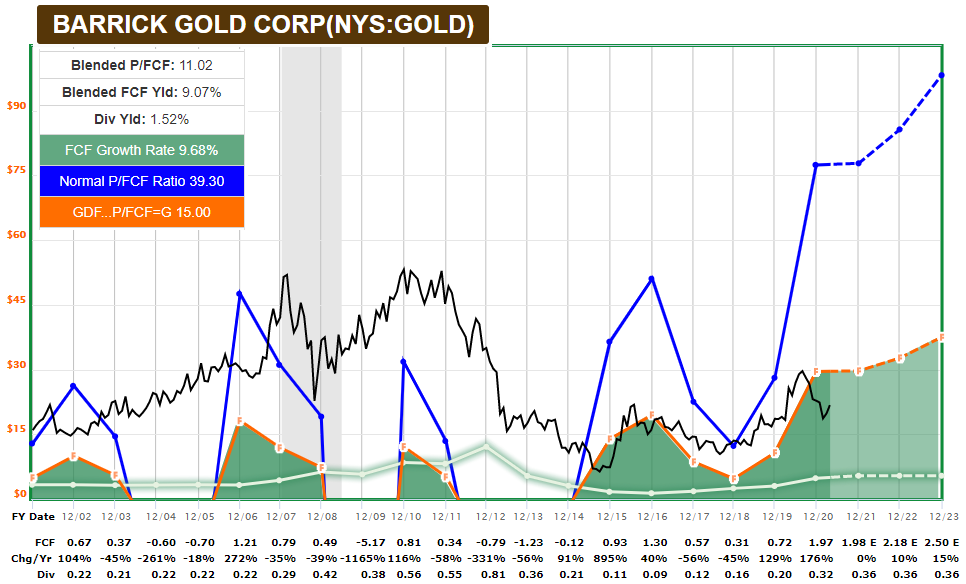
While higher gold prices would of course benefit the stock, even at current prices, their profitability level is very solid, and allows them to improve their balance sheet, grow their business, and pay dividends.
Barrick’s stock recently had a positive MACD crossover on the weekly chart:
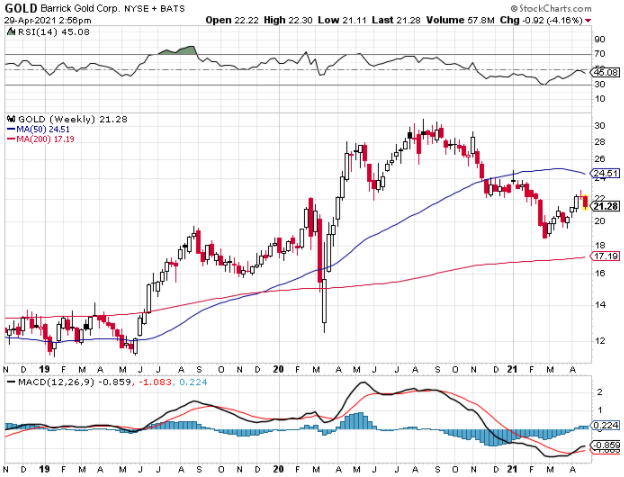
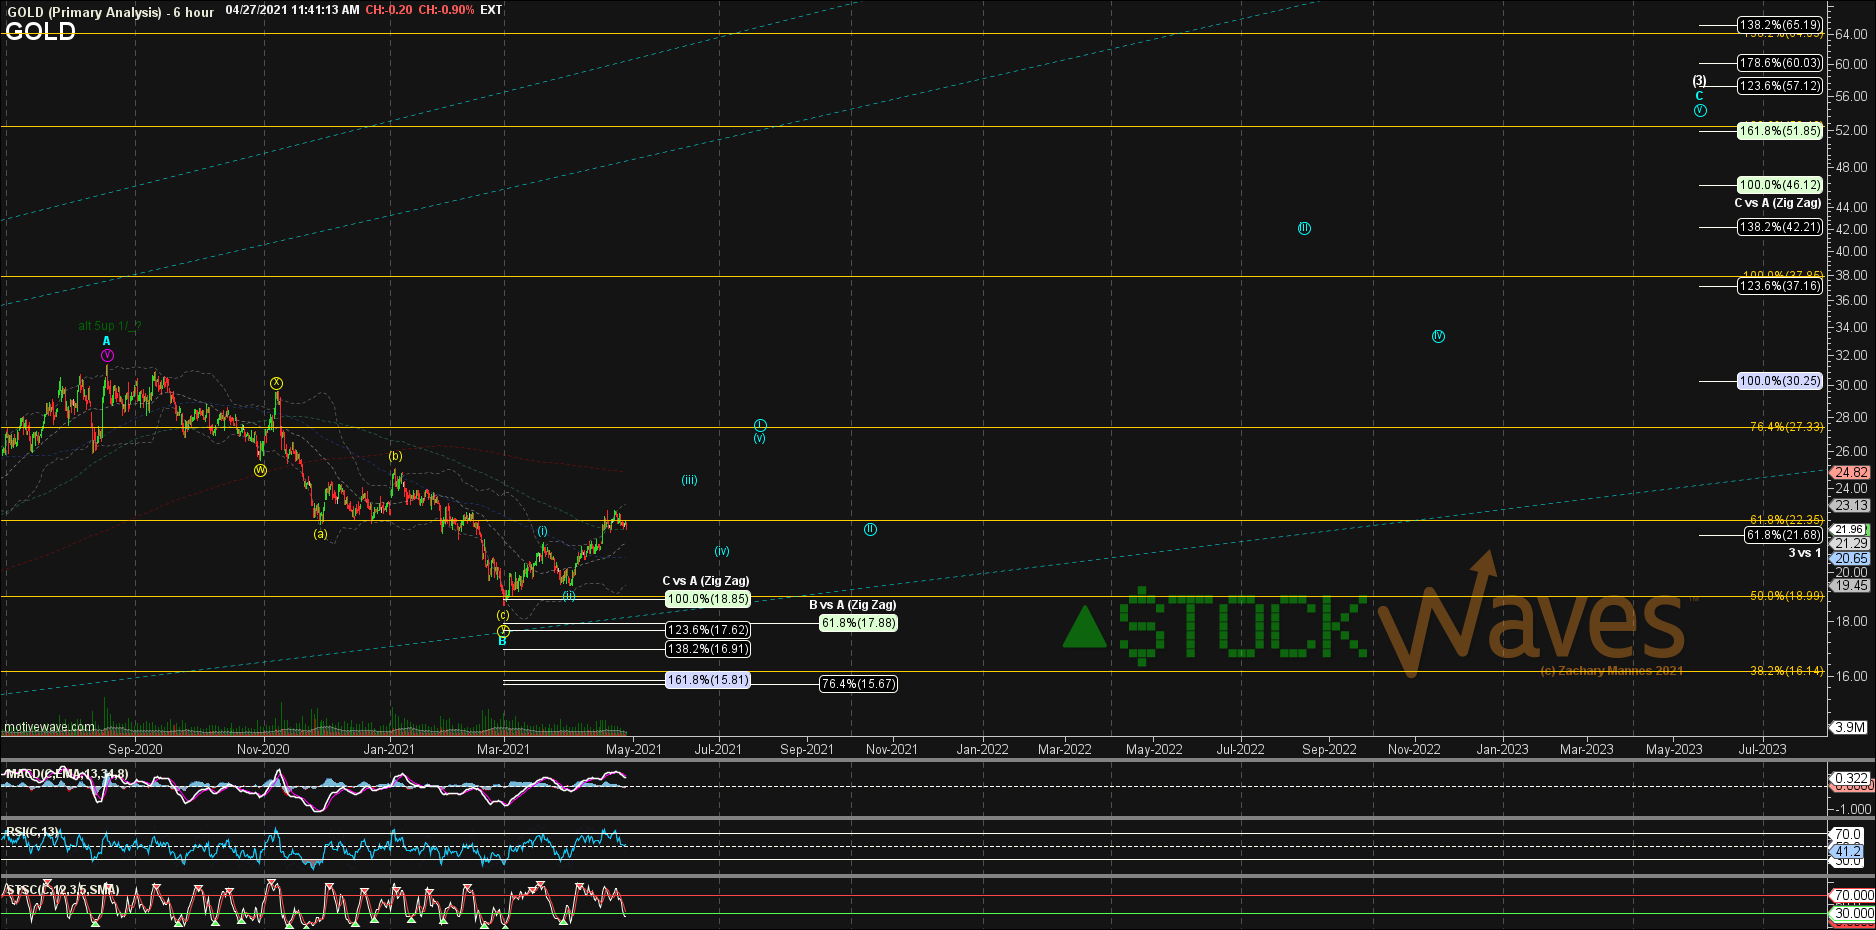
Zac has a rather bullish outlook on the stock for the next few years:
While I wouldn’t rule out another lower-low in gold or gold miners, the overall risk/reward looks better in their favor than it has for months. Inflation has a good possibility of running hot here, nominal Treasury yields are unlikely to keep up, and gold has been rising from a rather depressed state with positive technical momentum in place.
