Where Fundamentals Meet Technicals: CSCO and Review
 By
Lyn Alden
By
Lyn Alden
Cisco (CSCO) stock is pretty interesting at current prices. The technical/sentiment analysis has been a bit mixed between our Elliott Wave analysts, but I think solid fundamentals represent a reasonable tiebreaker here. Count me in the long-term bullish camp.
The Valuation
Unlike many stocks, Cisco was in a downtrend before this virus/recession struck. The stock topped out in mid-2019 in overvalued territory based on over-optimistic assumptions, and then began to fall back down to what I would consider approximately fair value relative to its growth rate, opportunities, and risk. The virus, economic shutdown, and broad market crash then of course pulled it still lower.
Two decades ago, Cisco was one of the quintessential dotcom bubble stocks. The long-term F.A.S.T. Graph shows the magnitude of how its stock price outpaced fundamentals back then:
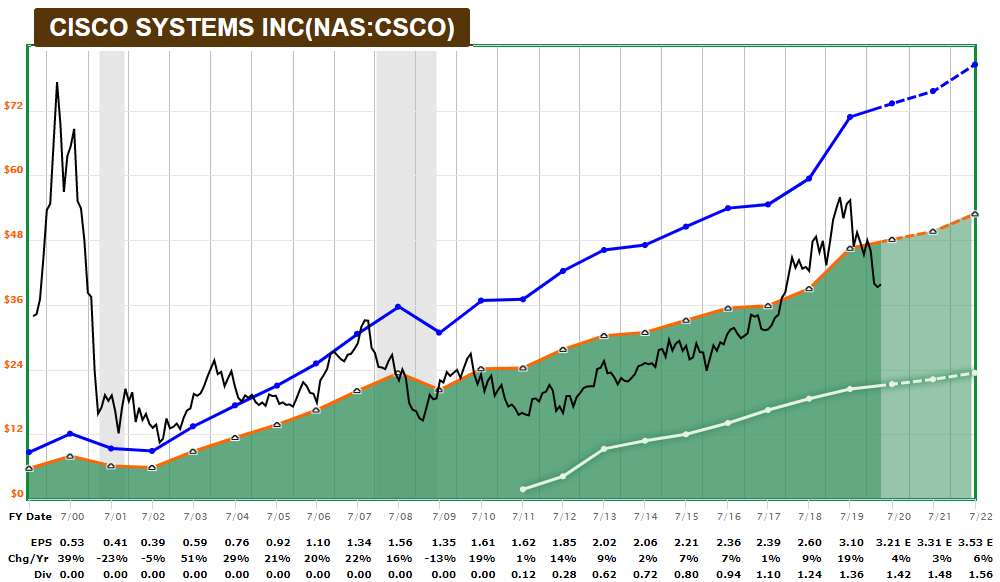
Since then, the stock itself never reached that level again due to obscene overvaluation, but the company itself has done very well. Their revenue and earnings have continued to grow, and within the past decade they initiated a growing dividend as well.
Here is a look at the more recent F.A.S.T. Graph, which re-sets the lines based on more recent data within the selected timeline:
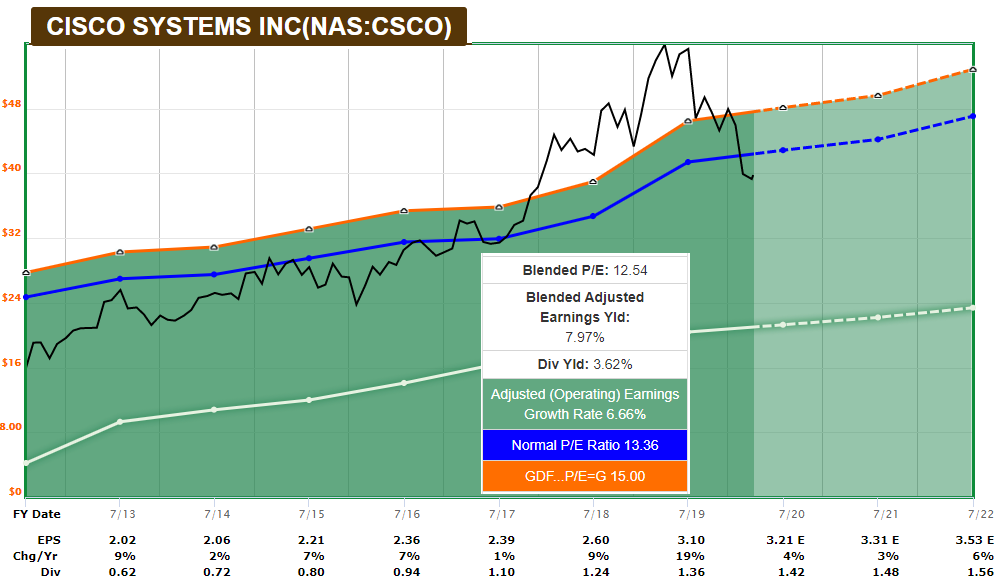
Before the virus, analysts were looking for 5% annual growth for the next 3 years. Now the estimates are a couple percent lower, but forward estimates for the next year or two need to be taken with a grain of salt in this environment, for better or worse. We’re in depression conditions with ten million Americans unemployed in 2 weeks with an unusual viral event and economic shutdown response.
The company makes over $11 billion in net income per typical year, and its annual free cash flow levels tend to be even higher. Last year, free cash flow was over $14 billion. The trailing price to earnings ratio is around 15x, and the trailing price to free cash flow ratio is a little over 12x.
The dividend yield is currently around 3.6%, meaning the stock can provide solid total returns even with modest growth, and is a nice candidate for a dividend growth portfolio.
The Transition
Cisco is a business in transition. They are the worldwide leader in network switches and routers, which form the hardware backbone of the internet. They also make wifi hardware and a variety of other networking equipment, and have a large business in network security, VOIP software, IoT, and other areas.
The key risk for the company is that network switches and routers have become somewhat commoditized, especially as many things shift towards the cloud.
Many of the hyperscale datacenter companies (think the FAANG stocks and Microsoft) now use their own white-box network equipment, sourced from the same chip providers that Cisco sources from, including Broadcom (AVGO). Basically, these hyper-cap companies are far bigger than even Cisco (which itself is a mega-cap stock), so it’s cost-effective for them to make their own.
Some smaller businesses choose to use generic switches and routers as well. So, Cisco needs to differentiate itself.
Over the past few years, Cisco has been shifting more towards software and subscription revenue, particularly with their highly-successful Catalyst 9000 set. Rather than just sell networking hardware, they are transitioning to selling hardware that comes with an annual payment to receive various support and software.
This business transition for such a large company comes with risks. Revenue has been relatively flat, but operating margins have been on the rise after bottoming back in 2014. After the company completes its transition, it should be able to boost revenue growth a bit, although there is execution risk for the company.
The IoT opportunity is a long-term additional speculative growth area for the company, as it will take a lot of networking equipment and software to tie that all together for enterprises. Cisco has a nice place in this market unless they drop the ball.
Despite not being a very cyclical stock or very hard-hit by the virus yet, the company is doing layoffs at some level to trim where appropriate and keep costs under control.
The Balance Sheet
Cisco is a financial fortress, with one of the best corporate credit ratings; AA- from Standard & Poor’s.
As of the most recent quarter, Cisco has $27 billion in cash-equivalents and $16 billion in total debt, meaning they are net-debt free and have a ton of liquidity. This also gives them ongoing ability to buy competitors or bolt-on hardware and software technologies.
The Technicals
In terms of sentiment, Garrett sees Cisco as potentially already having bottomed in this cycle, with the potential to double within five years in addition to annual dividends:
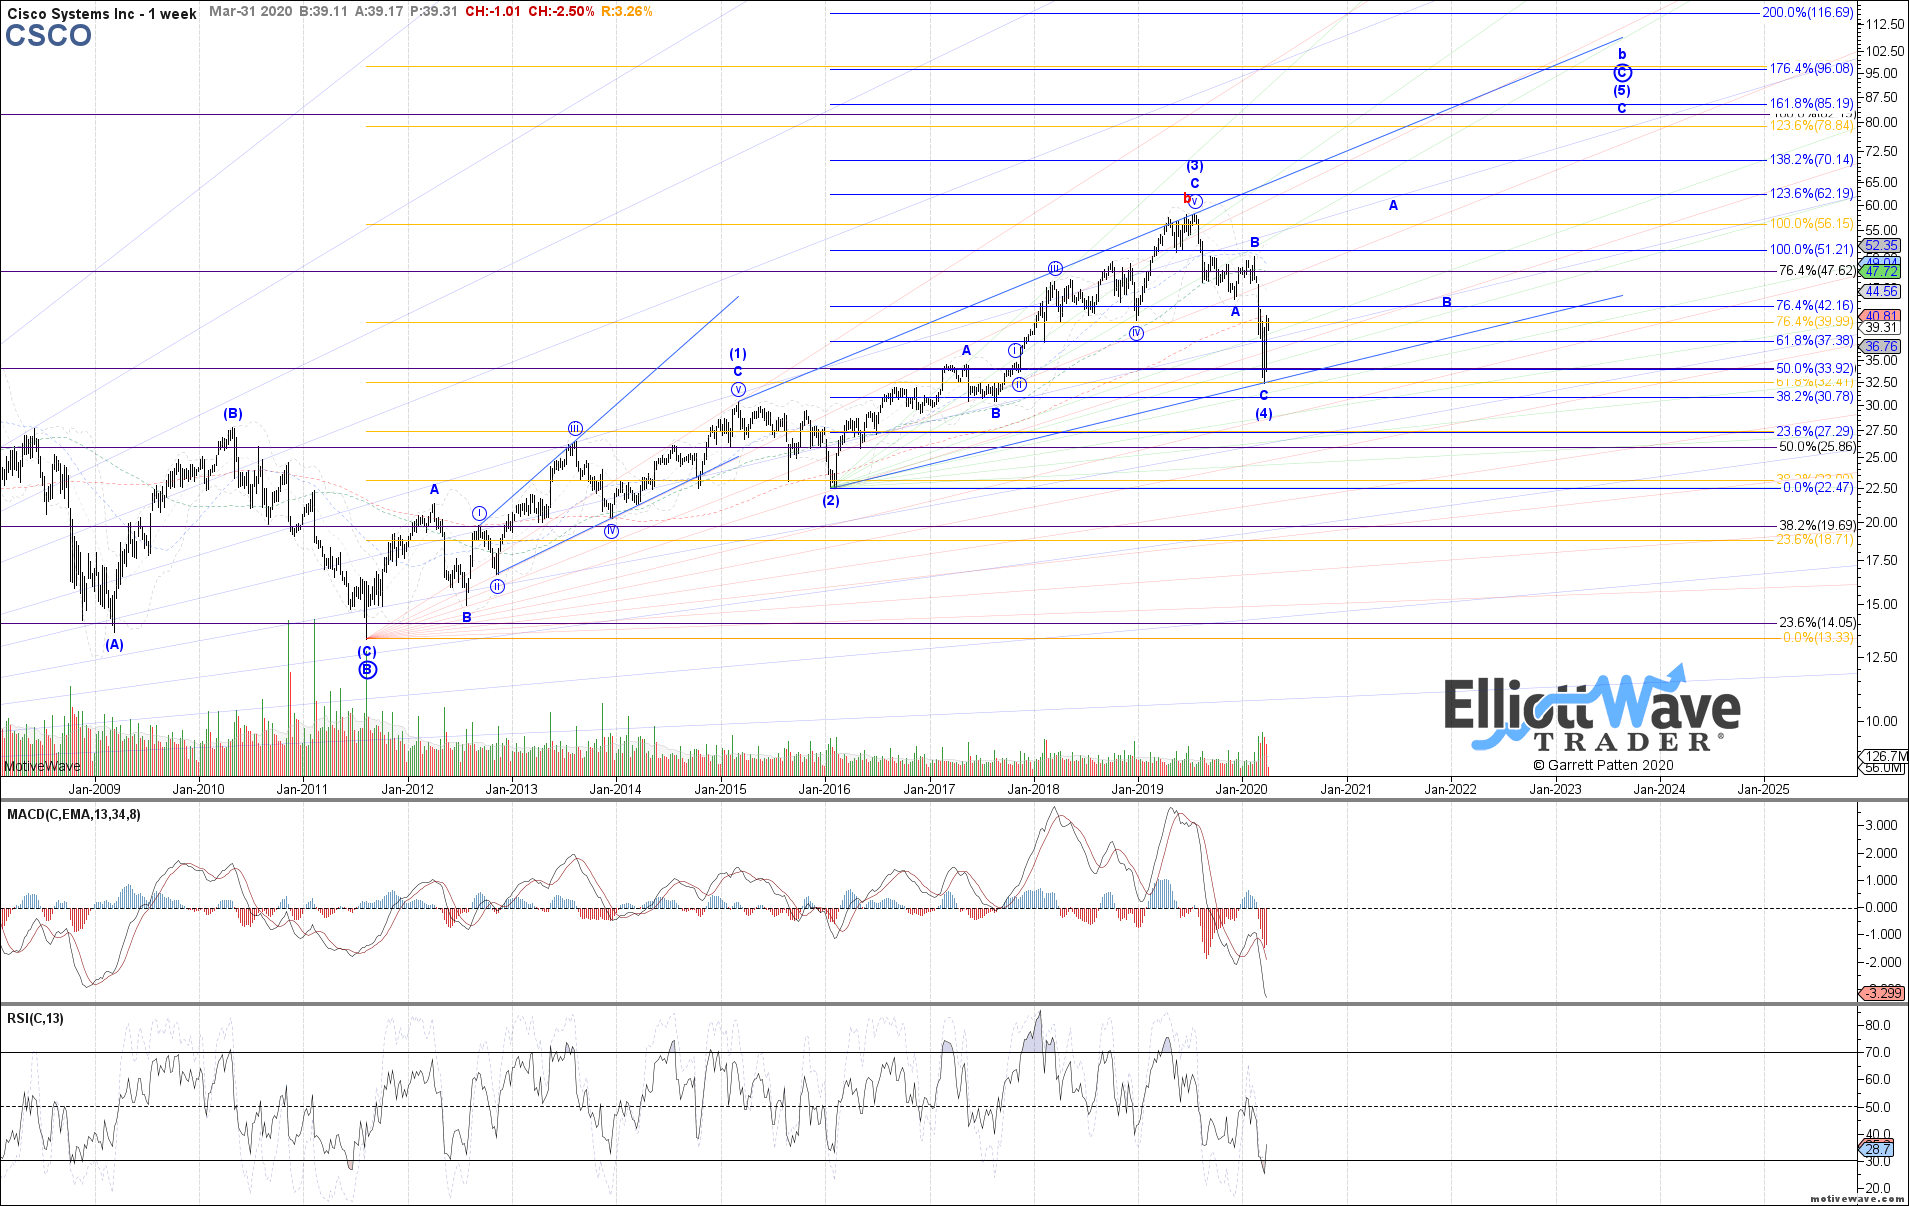
I don’t know how it’ll play out in detail, but considering the fundamentals, it looks like reasonable, at last for the higher-end of possible outcomes.
From a basic technical view on the weekly chart, the company recently reached oversold levels on the weekly RSI indicator, and has turned up but remains relatively depressed, which gives a nice runway for further increases.
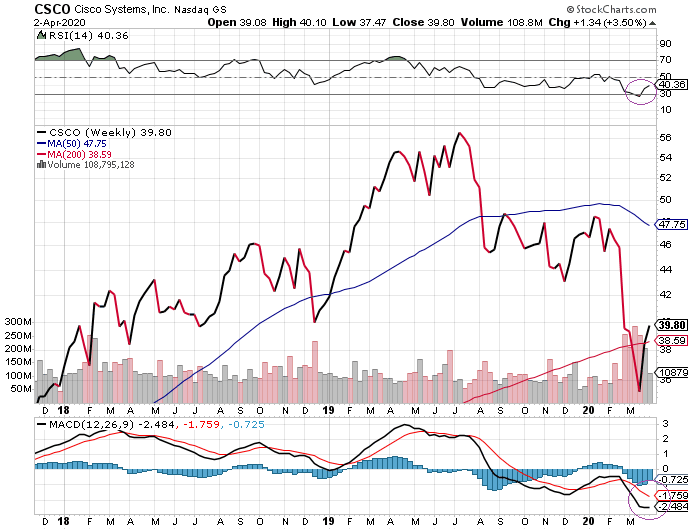
MACD on the weekly chart is also very low, but with early signs of it starting to form a base. MACD hasn’t formed a bullish crossover yet on the weekly chart, but the 12-week line is starting to flatten its curve at least.
It’s of course still possible that Cisco could sell-off deeper, especially if the overall market turns down again, which is my base case probability.
However, now that the initial “Oh god sell everything!” margin call phase of this bear market with breathtaking volatility is seemingly done with for now, sell-off days seem more selective in nature, and Cisco is a stock that I suspect will hold up better than the broad market from here. We’ll see.
Where Fundamentals Meets Technicals: Performance Checkup
I’ll take a moment here to do a performance review of the “Where Fundamentals Meets Technicals” series, which has been popular both in the Seeking Alpha marketplace and on Elliott Wave Trader versions of Stock Waves. This column blends fundamental/valuation analysis with technical/sentiment analysis more closely than any other type of article in this service, and it has been a great project so far.
Even though I’m generally a bull by nature (I only occasionally short stocks), the vast majority of our “Where Fundamentals Meet Technicals” articles have been bearish since inception of the series in January, because that’s what the combination of fundamentals and technical were telling us.
The impact from the virus was of course a spectacular variable that brought forward a lot of pain to asset prices and provided a large negative shock than anyone expected, but it was like lightning hitting a dry forest; the conditions for a big sell-off were already there thanks to overvalued and overbought conditions, and just needed some sort of shock to serve as a catalyst. The catalyst we got was more problematic than most were expecting.
January 26, 2020: MA, AAPL, MSFT, GOOGL
The first issue of “Where Fundamentals Meets Technicals” focused on mega-cap stocks including Mastercard (MA), Apple (AAPL), Microsoft (MSFT), and Alphabet (GOOGL) and showed a likely bearish path for them both fundamentally (in terms of being overvalued) and technically (in terms of peak positive sentiment, forming a probable top).
As of this writing, all of them are indeed lower, ranging from 5-26% down, even after the market’s recent bounce.
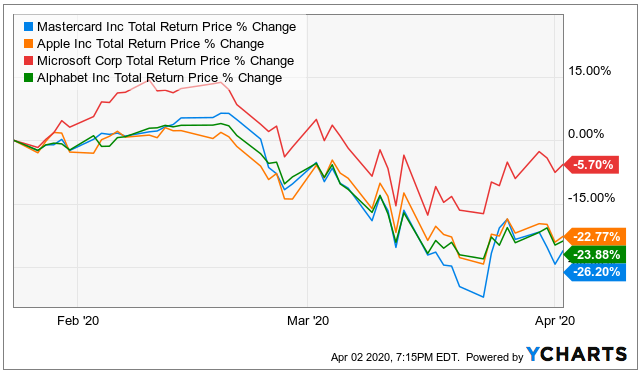
Score: 4 out of 4
February 4, 2020: TSLA
The second issue of “Where Fundamentals Meets Technicals” focused exclusively on Tesla (TSLA) during the very peak of its mania phase, with a bearish view, and I warned to have significant caution with this name.
I too ended up shorting it after publication, and disclosed the short in the chat and in the Google Drive model portfolios, although I didn’t hold the short as long as I should have.
The stock is down over 40% as of this writing, and reached as low as 60% down during a recent local market bottom. It is currently rallying after-hours due to a good delivery report.
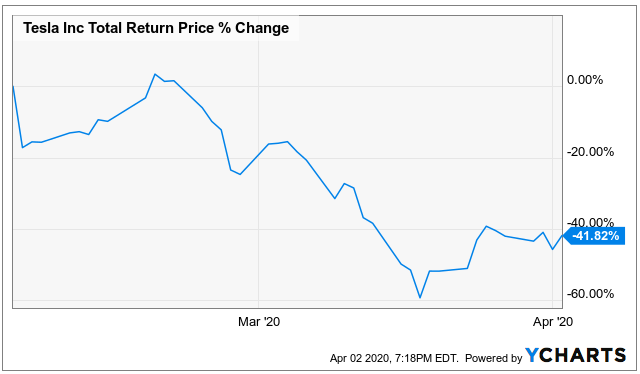
Keep in mind that if a stock is down 40%, it requires a 66% rally to get back to break-even.
Score: 5 out of 5
February 12, 2020: JPM, IRBT
The third issue of the series focused on J.P. Morgan Chase (JPM) and iRobot (IRBT). Our view was bearish on JPM and bullish on IRBT.
Our bearish view on J.P. Morgan played out more dramatically than I would have guessed due to the virus; it has gone down 36% since the article. For reasons described in the article, banks like J.P. Morgan have been especially hard hit by this market crash.
We did, however, have a bullish view on IRBT, but it is down 25%. It has had poor absolute performance as a small-cap in this volatile environment, although it has outperformed the broad small-cap index (compared to small cap ETFs like VB and IWM that are down 35%), which would serve as its closest benchmark.
Score: 6 out of 7
February 20, 2020: INTC, WMT
The fourth issue focused on Intel (INTC) and Walmart (WMT) and was fairly bearish, at least for the near-term, on both of them even though neither of them were particularly overvalued. They faced problematic near-term headwinds.
Intel is indeed down almost 17% since the article was published. Walmart is relatively flat, with a 1% gain. Walmart is one of the major grocer/pharmacy/retailers that has been able to remain open in this national quarantine.
Score: 7 out of 9
February 27, 2020: The Dark Side + MA, AAPL, MSFT
The fifth issue of the series took more of a macro view on the broader equity index, and suggested that major stock indices, as well as popular mega cap stocks, still have plenty of potential room to fall despite their recent sharp dip, and that this is looking like a recession rather than just a temporary issue. In other words, while many analysts are focusing on the virus itself, this emphasized how highly-valued stocks in general were, and the fact that many economic indicators were looking recessionary before the virus struck.
Three stocks were used as examples: Mastercard, Apple, and Microsoft.
Microsoft held up the best since then but is still down almost 2%. Apple and Mastercard are down over 10% and over 16% respectively.
Score: 10 out of 12
March 5: EXPE, MAR
The sixth issue took a look at Expedia (EXPE) and Marriott (MAR). Our view was neutral on Expedia, referring to it as an inflection point, and bearish on Marriott. We emphasized the fact that although both are exposed to the troubled travel industry, Expedia was capital light while Marriott was capital intensive.
Both stocks are down well over 40%, as the travel industry continues to be pounded by virus-related shutdowns.
Score: 11 out of 14
March 13: ADBE
The seventh issue looked at several broad macro subjects, re-emphasized my preference for precious metals, and then took a look at the blended fundamentals and technicals of Adobe. Our view leaned bearish on the company due to its expensive valuation.
Prior to this article, Adobe had significantly outperformed the S&P 500 during the market crash. And yet, after this article so far, Adobe underperformed the S&P 500.
In other words, we took aim at a stock that had held up strongly by that point, and suggested that such a state may not continue, which ended up being the case as of this writing.
Score: 12 out of 15
Of the first seven articles, about 12 out of 15 fundamental/technical stock calls can be considered outright successful. Of the 3 that did not go as expected, iRobot did at least outperform its small cap benchmark by a wide margin so far, Walmart was relatively flat, and Expedia was a neutral/inflection call to begin with rather than one of our more high conviction calls like with Tesla or Marriott.
So, we’ve had a lot of positive feedback with this series so far, and I’ve enjoyed putting it together. It provides a quick overview of stocks with bullish or bearish fundamentals, and then a technical/sentiment view to provide a possible timing for entry on the long or short side as appropriate.
To wrap up, these latest two articles haven’t had much time for the outcome to play out at all yet, so I haven’t provided any rating yet, but they’re still worth mentioning in this overview.
March 18: NFLX, GOOGL
For the eighth issue of the series, we took somewhat bearish views on Netflix (NFLX) and Alphabet (GOOGL).
The Netflix view has been a miss so far as the stock has gone up significantly. Our view on Alphabet was more mixed, with a likely bounce and then more downside. So far it is up about 2% so its outcome is not clear. It has been about two weeks.
March 25: BRK.B, BABA, RIO
Our ninth and most recent issue, which also has had little time to be expressed, took a bullish view on Alibaba (BABA) and Rio Tinto (RIO), and a mixed-to-bullish view on Berkshire Hathaway (BRK.B) depending on one's timeline.
It has only been a week so I don’t consider any of these to be relevant yet, but RIO (the only one of the three that I’m long) is up over 3.5%. while the other two have been within 1% of flat.
For the Berkshire stock, I showed charts from Zac, Garrett, and Harry, to see where they agree or disagree. Zac and Harry saw a bounce and then probably more downside ahead for a real bottom. Garrett viewed the bottom has potentially already being in place.
