Where Fundamentals Meet Technicals: CI, PRU
 By
Lyn Alden
By
Lyn Alden
This issue of Where Fundamentals Meet Technicals looks at two stocks with different risk profiles.
Cigna
Cigna (CI) is a diversified health insurer and pharmacy benefits manager. Typically, healthcare stocks tend to hold up better than the broad market during periods of economic deceleration, since spending on healthcare doesn’t change much even as the rest of the economy softens.
I used Cigna as one of my quintessential bullish defensive stock examples all throughout 2022, and featured it prominently in my portfolios. And I’m still quite bullish on it over the long run.
However, in the intermediate term, the rally that it enjoyed all throughout 2022 as the rest of the market was struggling, has pushed it into historically expensive territory. I wouldn’t call it “overvalued”, since the numbers still make quite a bit of sense, but it’s marginally above its historical average valuation and rather overbought in the technical sense:
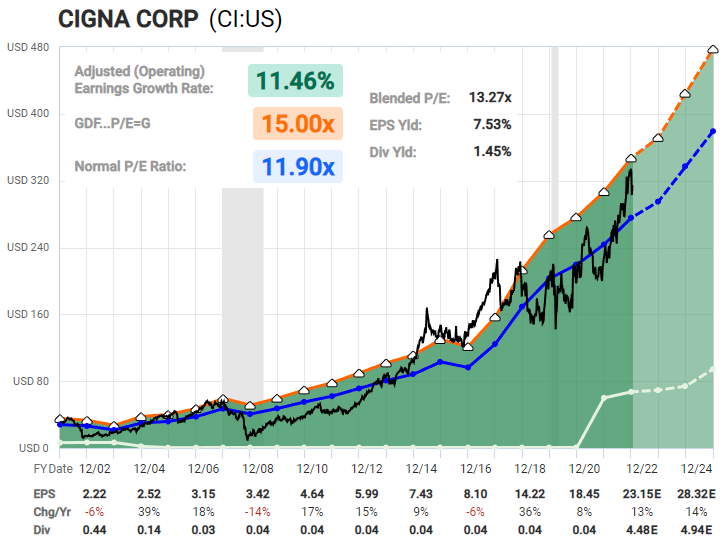
Chart Source: F.A.S.T Graphs
Zac sees a potential for a 20%+ decline from current levels. While I wouldn’t necessarily expect that as a base case, it’s certainly a reasonable bearish possibility, and in my view would represent a great re-entry point:
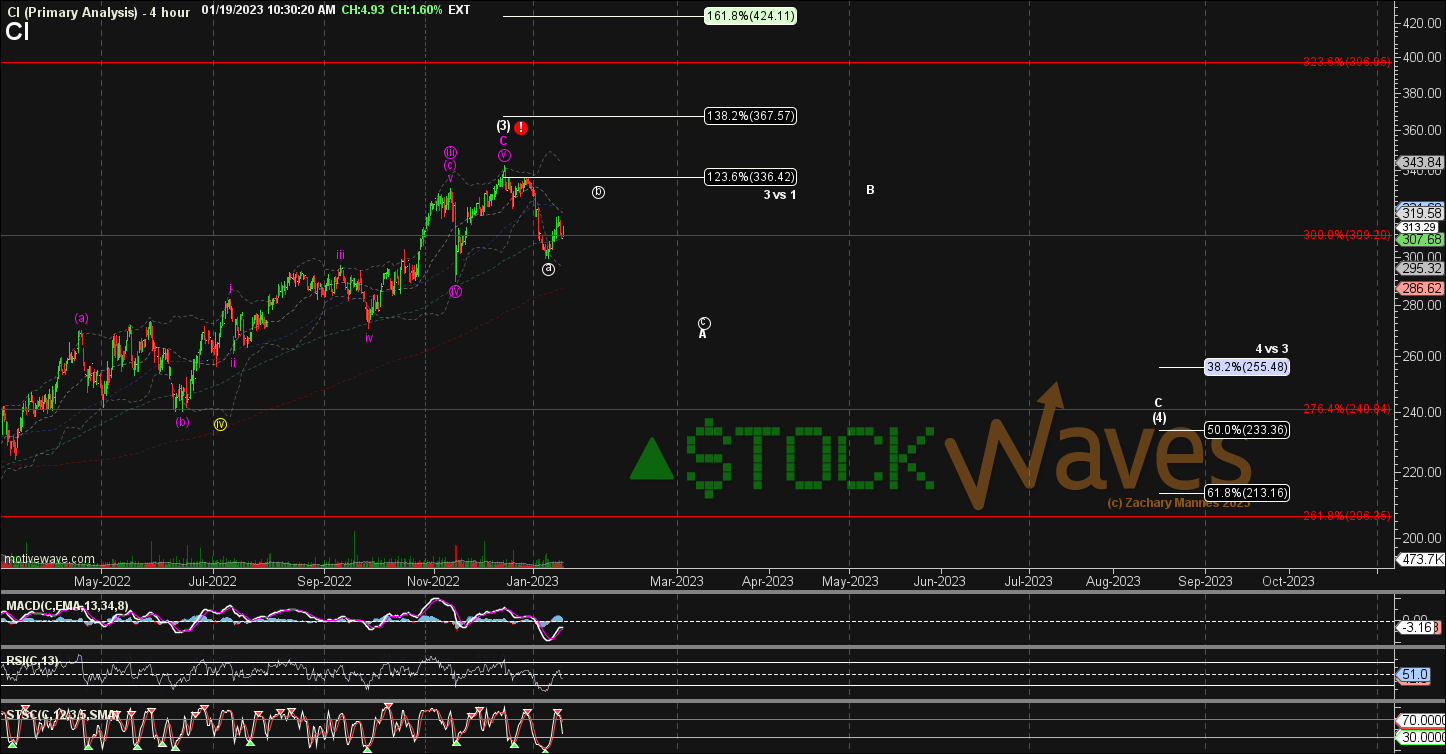
I am not selling my Cigna stock, since I don’t particularly want to create a taxable event in a long-term holding, but I do think it’s important to manage expectations for it over the next year or two, and be prepared for some degree of consolidation or drawdown.
Prudential
Prudential (PRU) was founded in 1875 and provides retirement planning services, investing services, and insurance. It’s a rather “old school” stock, with value characteristics, since it trades at a 10x price/earnings ratio and pays out a nearly 5% dividend yield. It's the kind of stock that didn't do very well in the 2010s decade but that I think has a reasonable shot of outperforming in the 2020s decade.
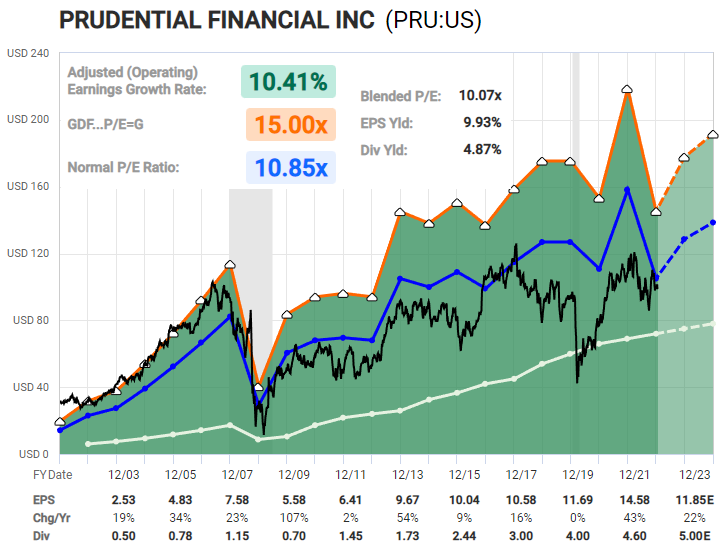
Chart Source: F.A.S.T Graphs
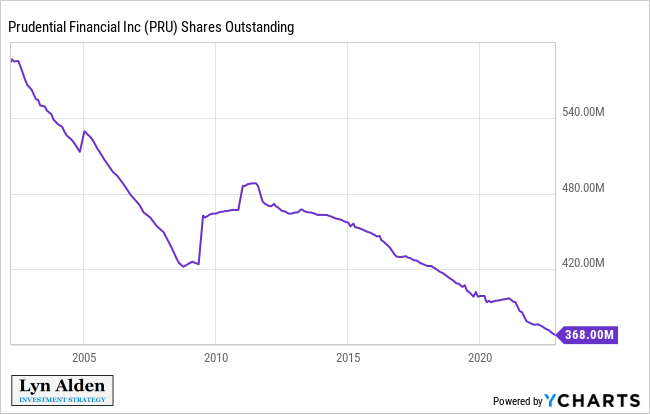
I view it as an attractive dividend/value holding as part of a diversified portfolio. At a 10x price/earnings ratio and little topline growth to speak of, it’s mostly a cashflow machine. A lot of the profits go towards dividends, and the rest of the profits mainly go to share buybacks, meaning that an existing holder of a share of the company owns a larger and larger stake in the company over time.
While there’s no clear price bottom in place yet for the recent consolidation, Garrett’s technical chart is constructive:
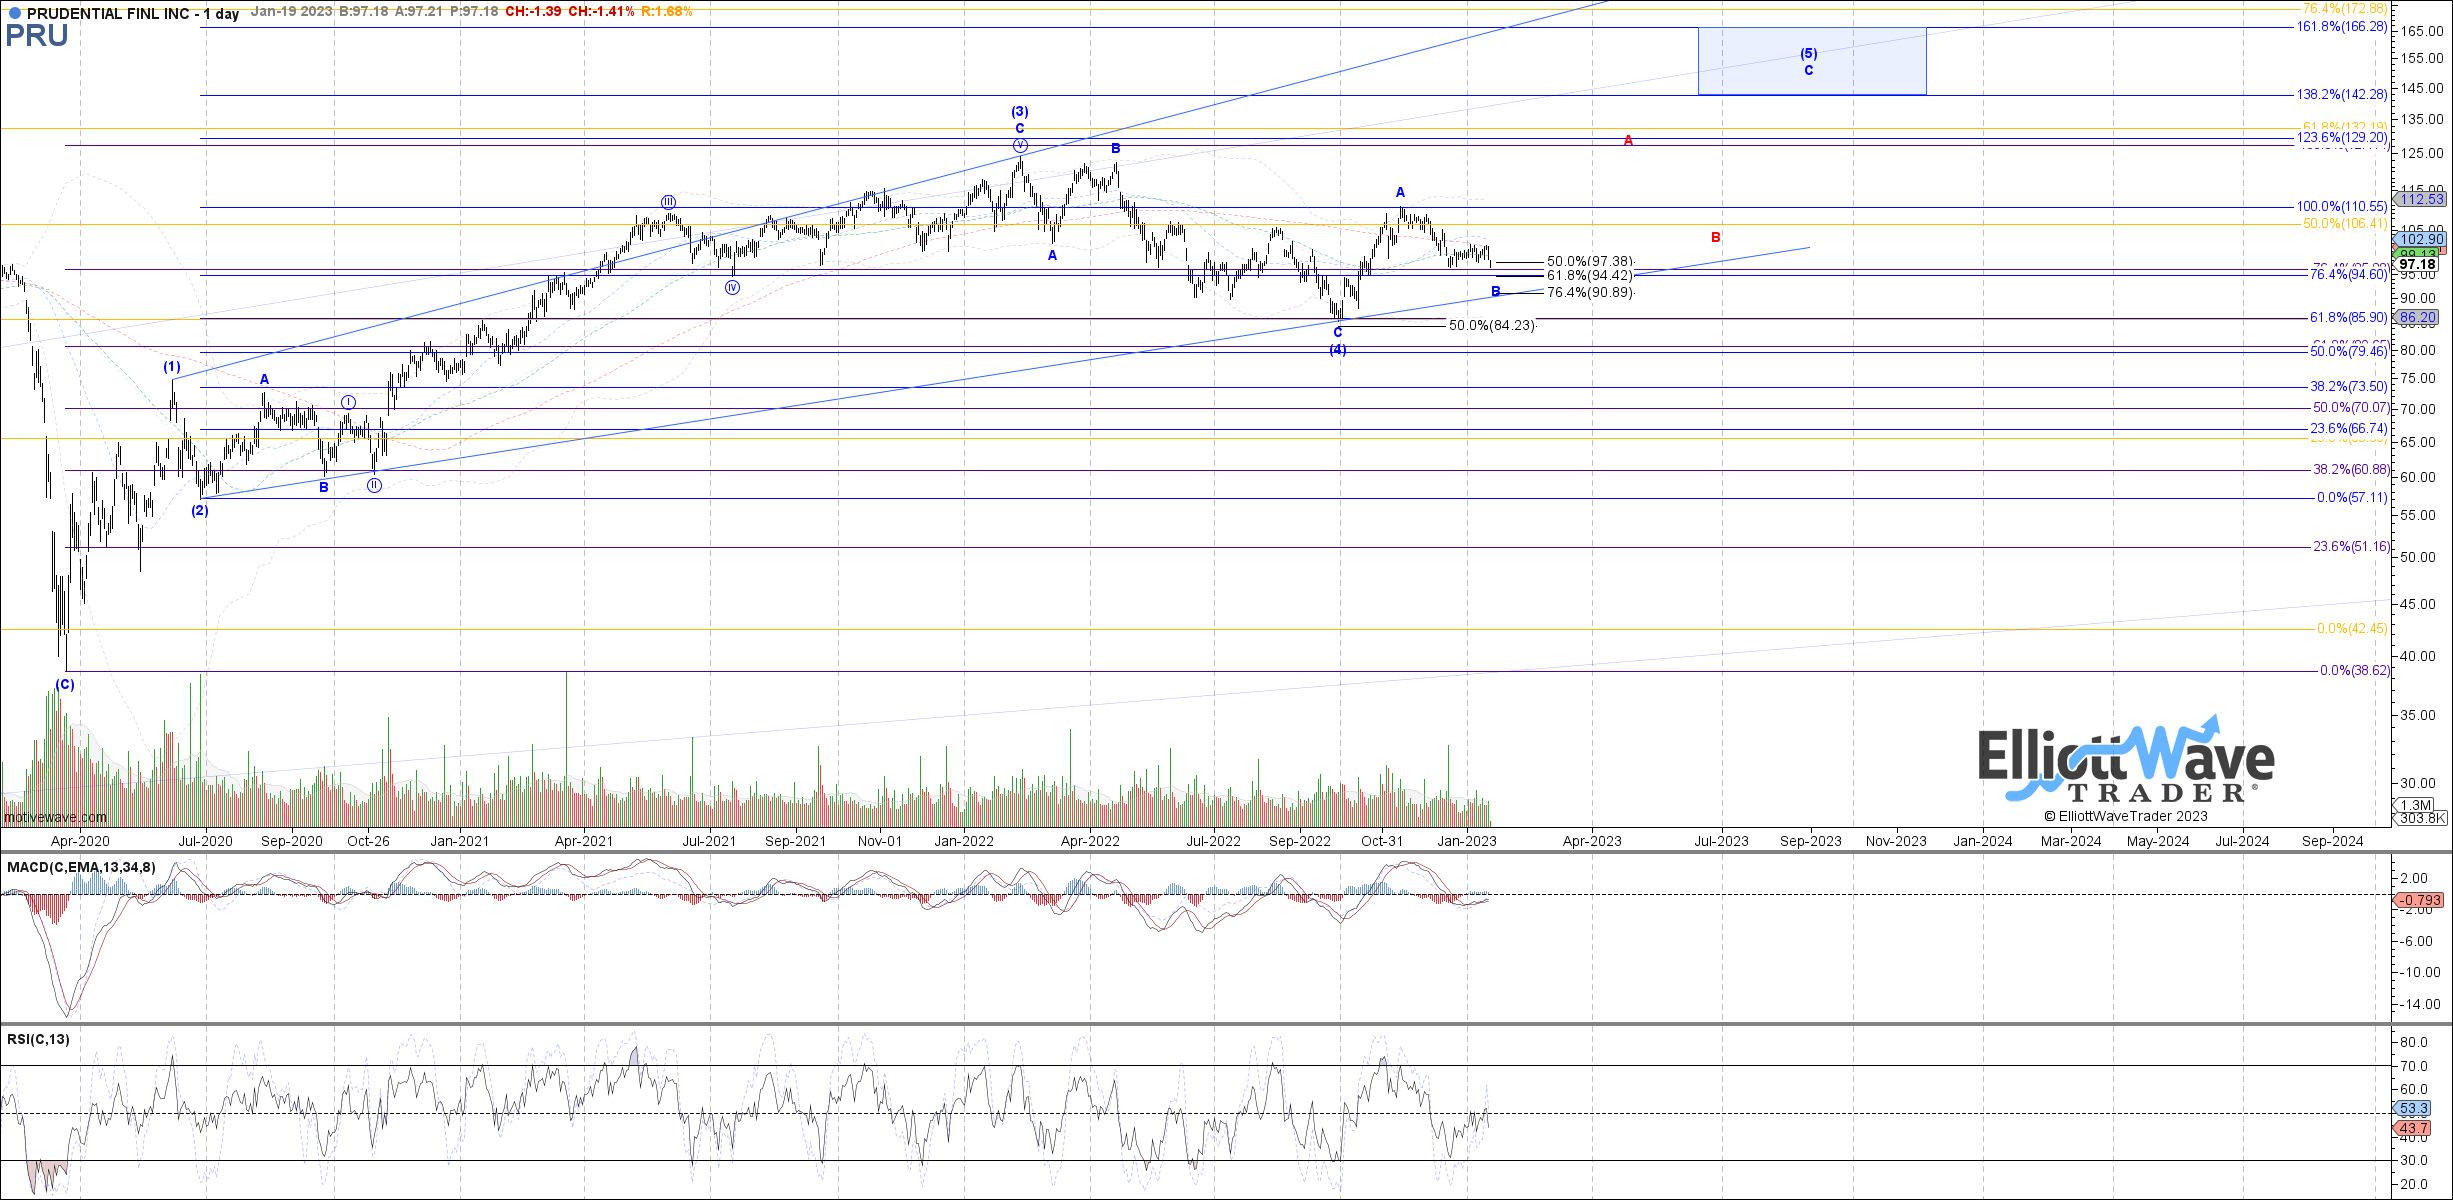
From a trading perspective, if the stock starts showing signs of a bottom, it will become interesting as a long opportunity, both fundamentally and technically. However, if it breaks below about $90, then that should give cause for concern about the technical setup and could serve as a stop loss and period of re-assessment.
