Where Fundamentals Meet Technicals: AXP, MSTR, WMT
 By
Lyn Alden
By
Lyn Alden
This issue of Where Fundamentals Meet Technical looks at two bullish and one bearish stock observations.
American Express
Garrett has identified American Express (AXP) as having a constructive chart in the technical sense:
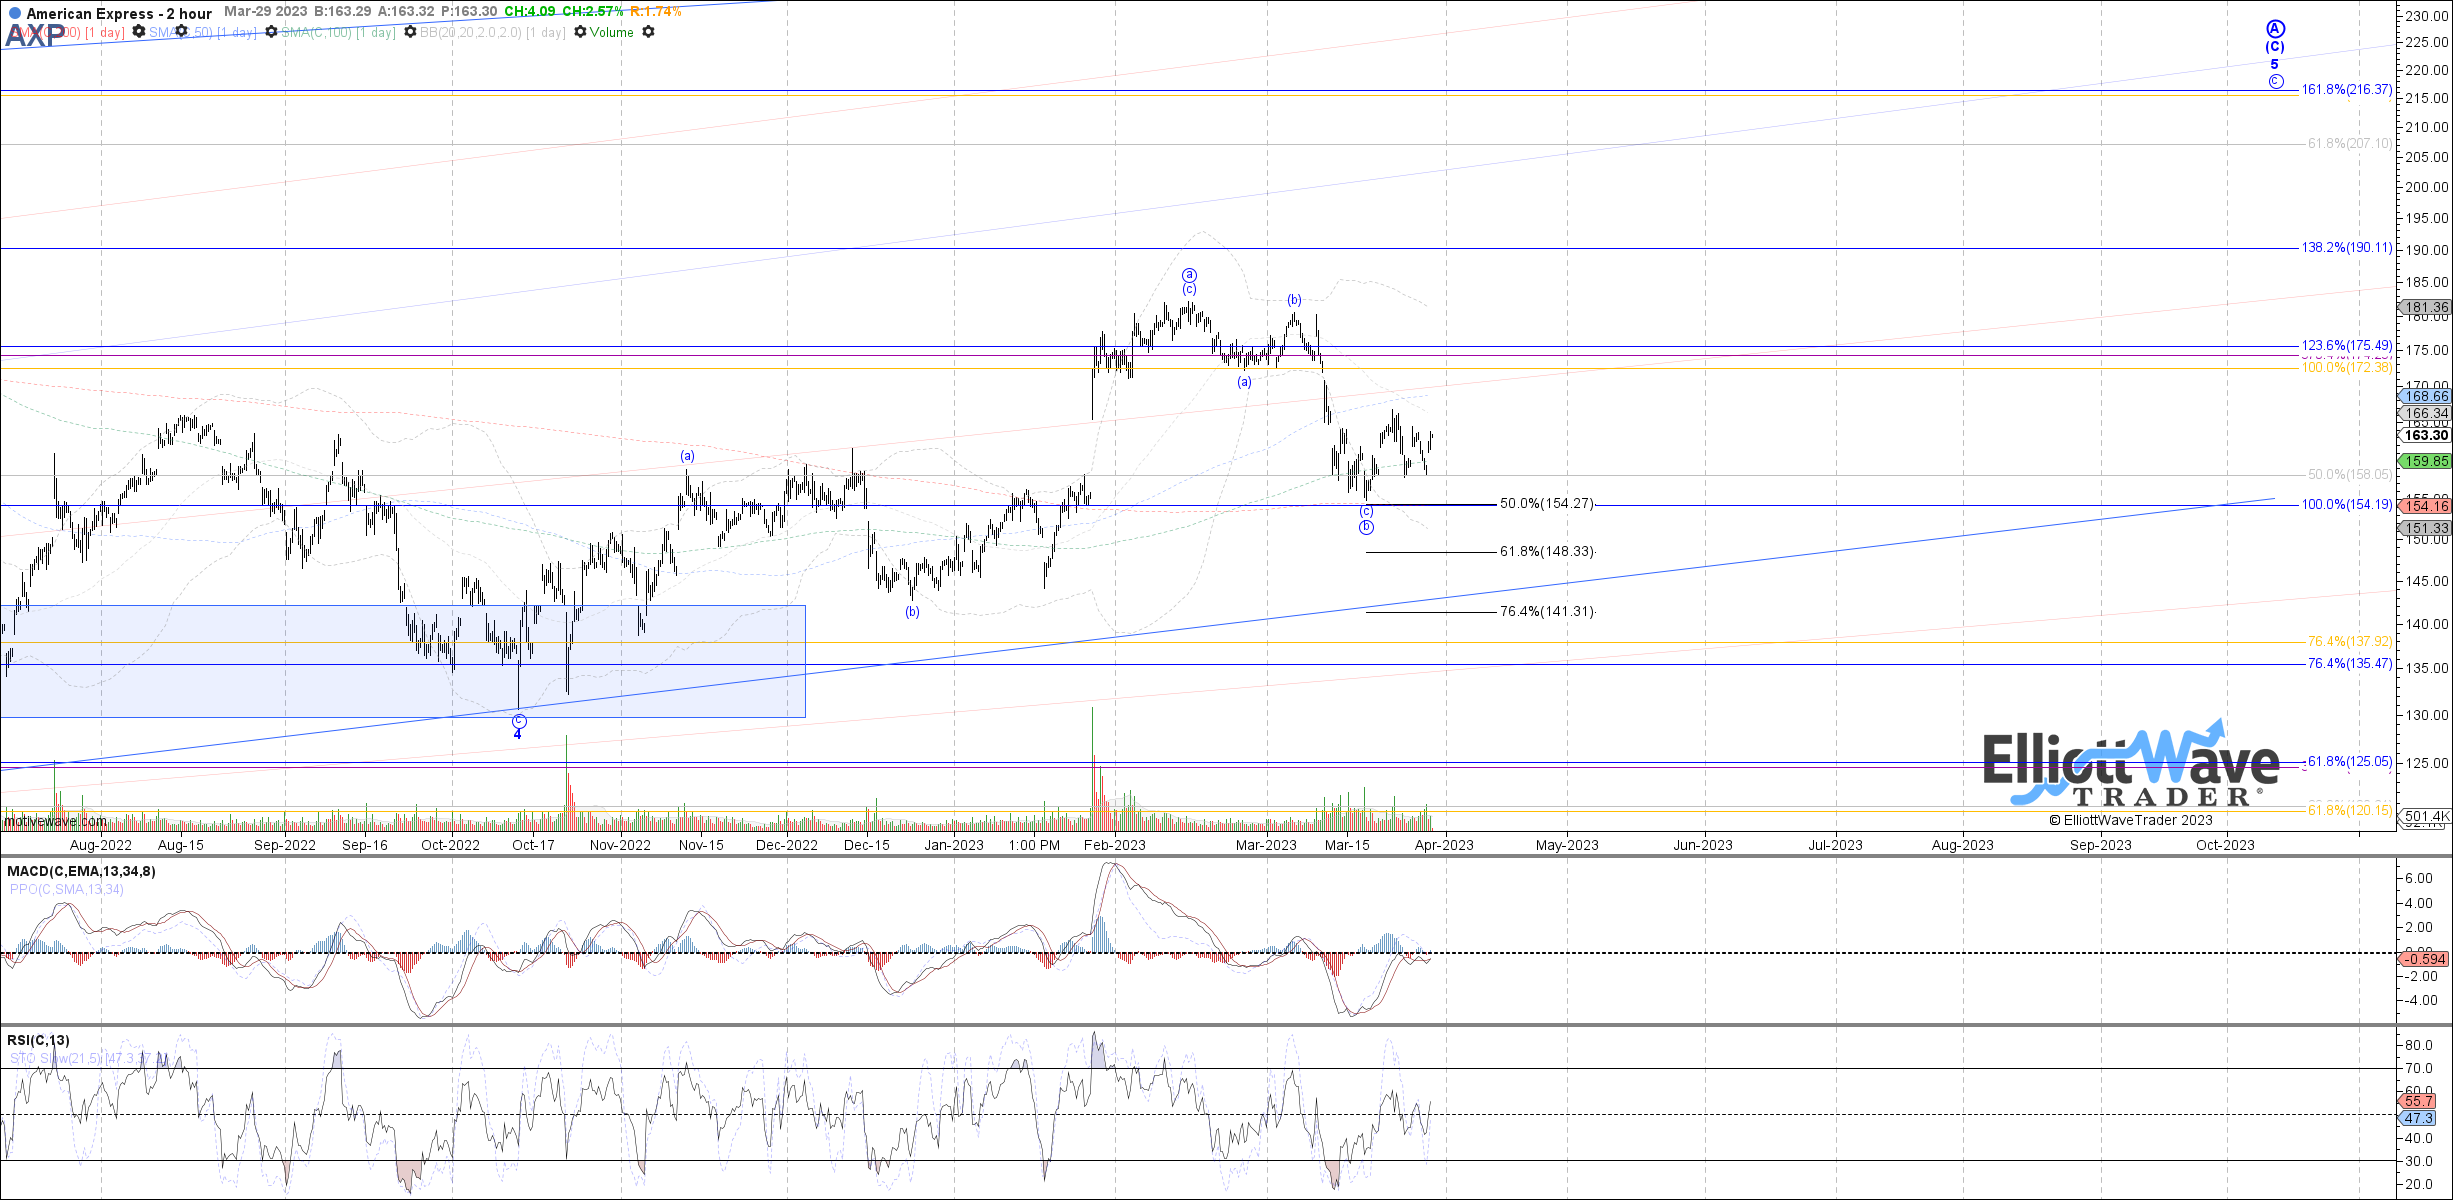
The risk/reward appears attractive here from a trading perspective, because the March lows can be used as stop-loss levels.
Fundamentally, analysts certainly are bullish:
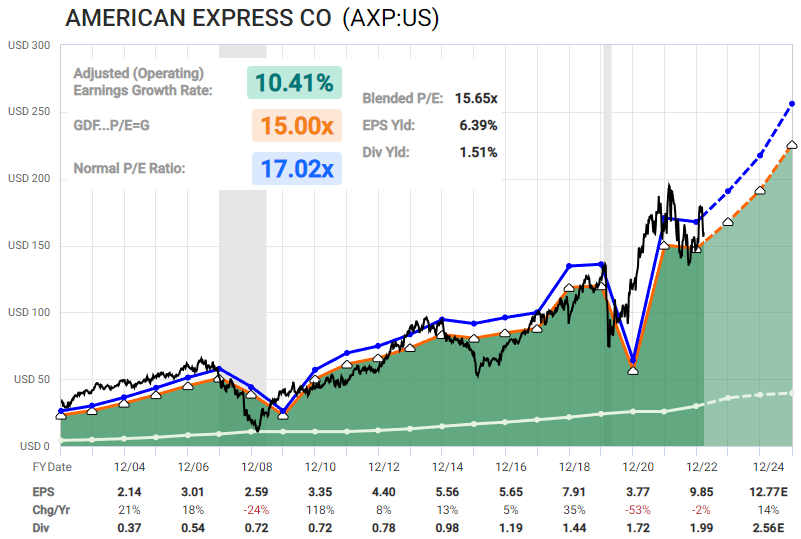
Chart Source: F.A.S.T. Graphs
Their credit delinquencies remain low, and they have been rather immune to this recent banking fiasco. I continue to be long-term bullish on the travel and dining segment due to pent-up demand, which is an area that American Express emphasizes. Their small business segment is more concerning due to tight monetary policy, which is what keeps me a bit on the sidelines but not bearish.
Overall, I think AXP is an interesting stock idea at current levels.
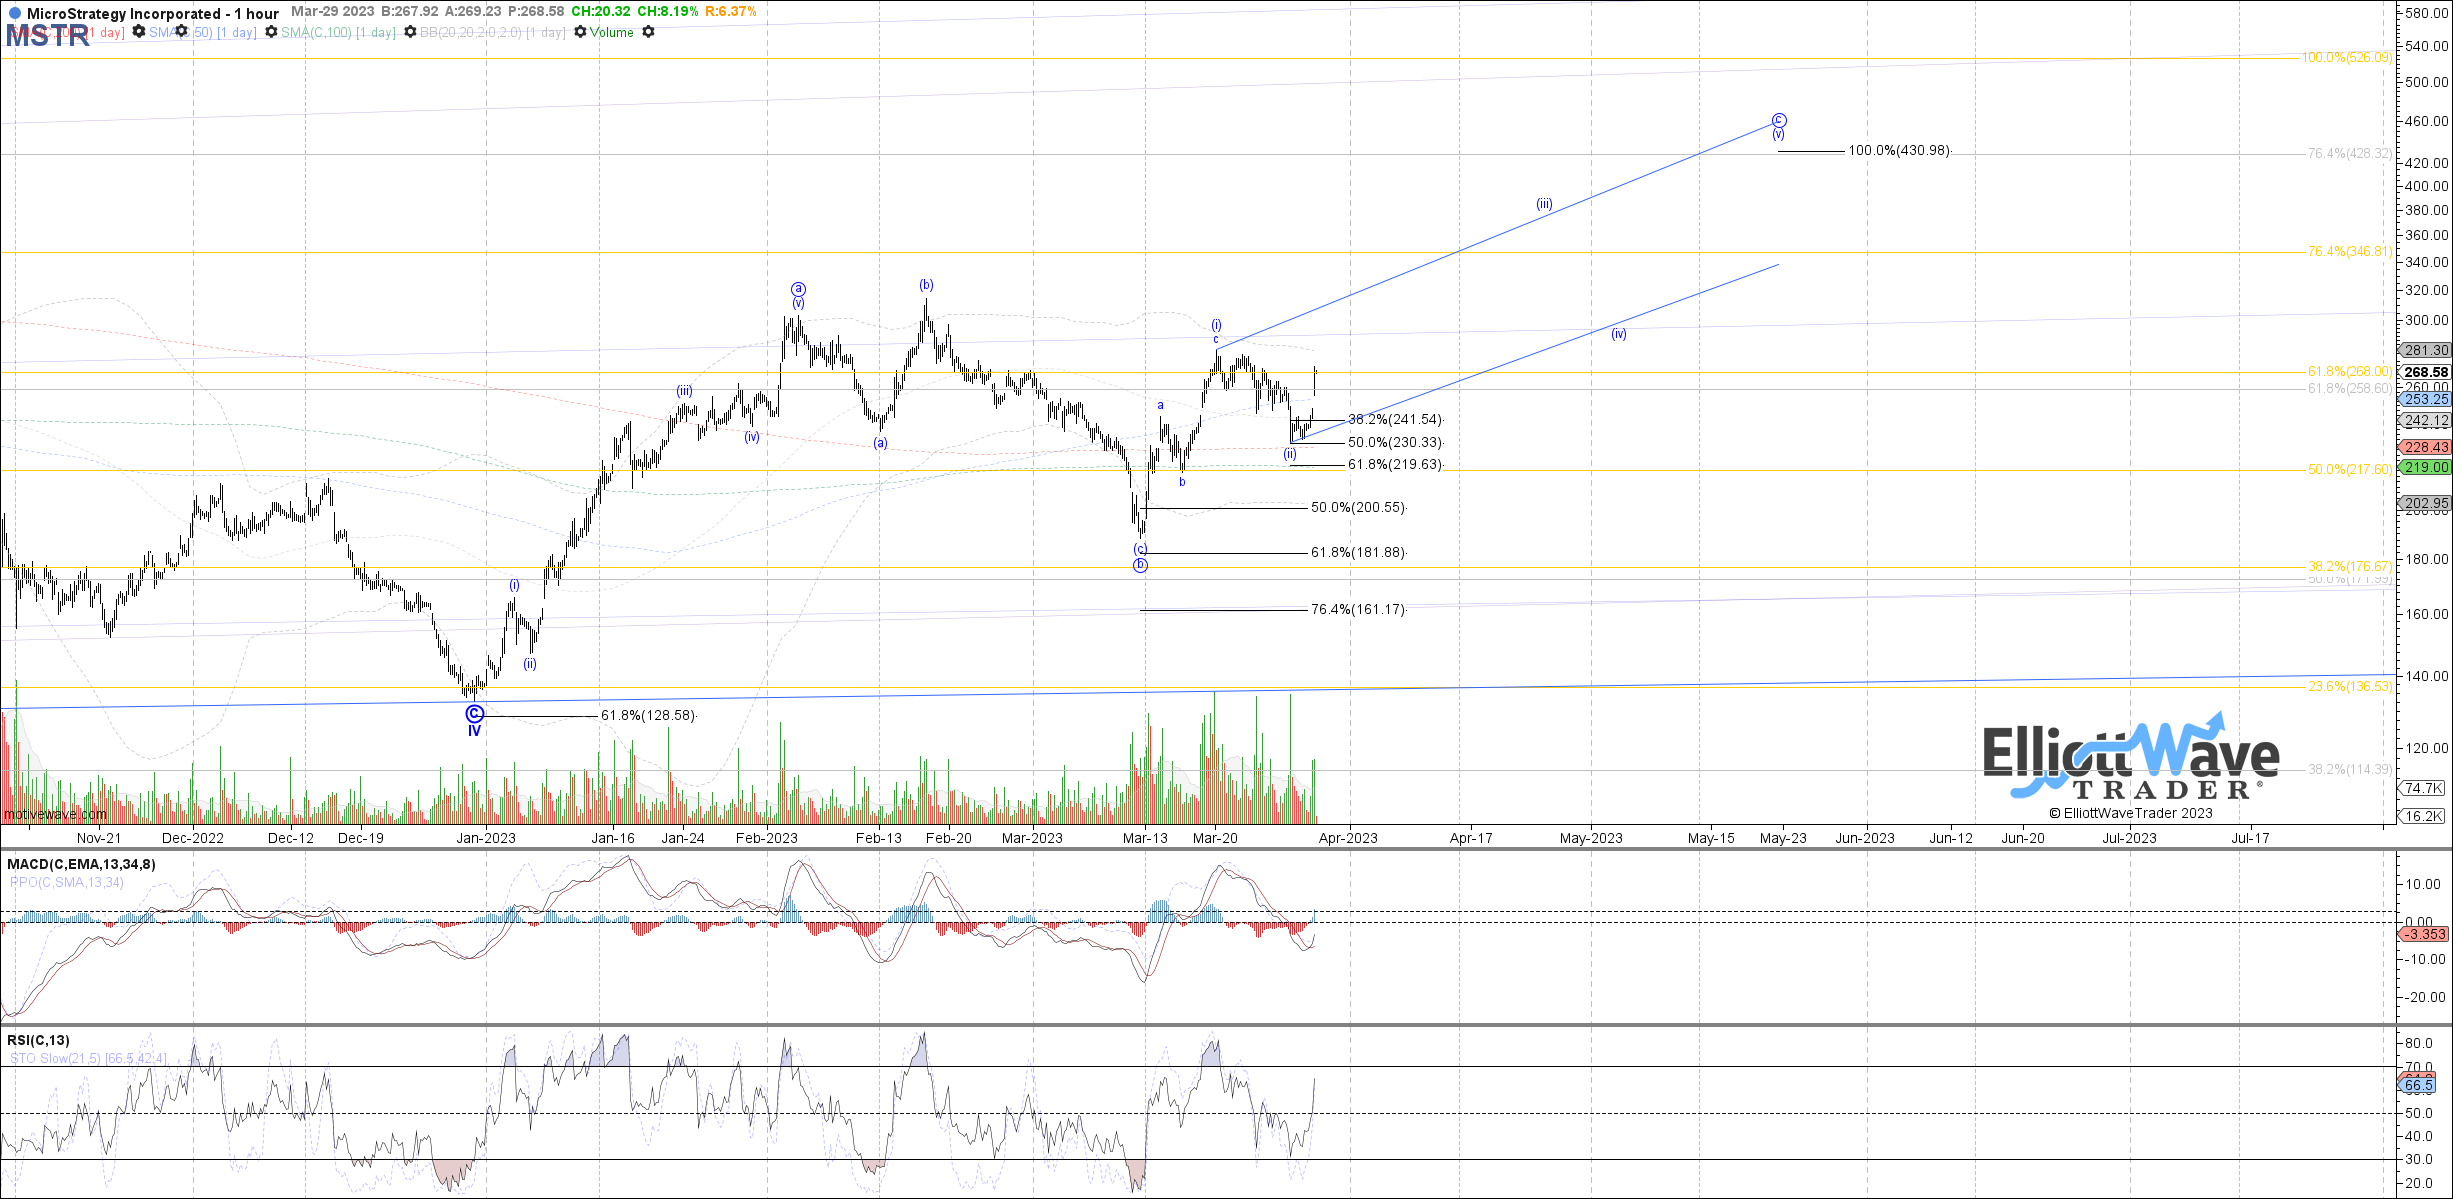
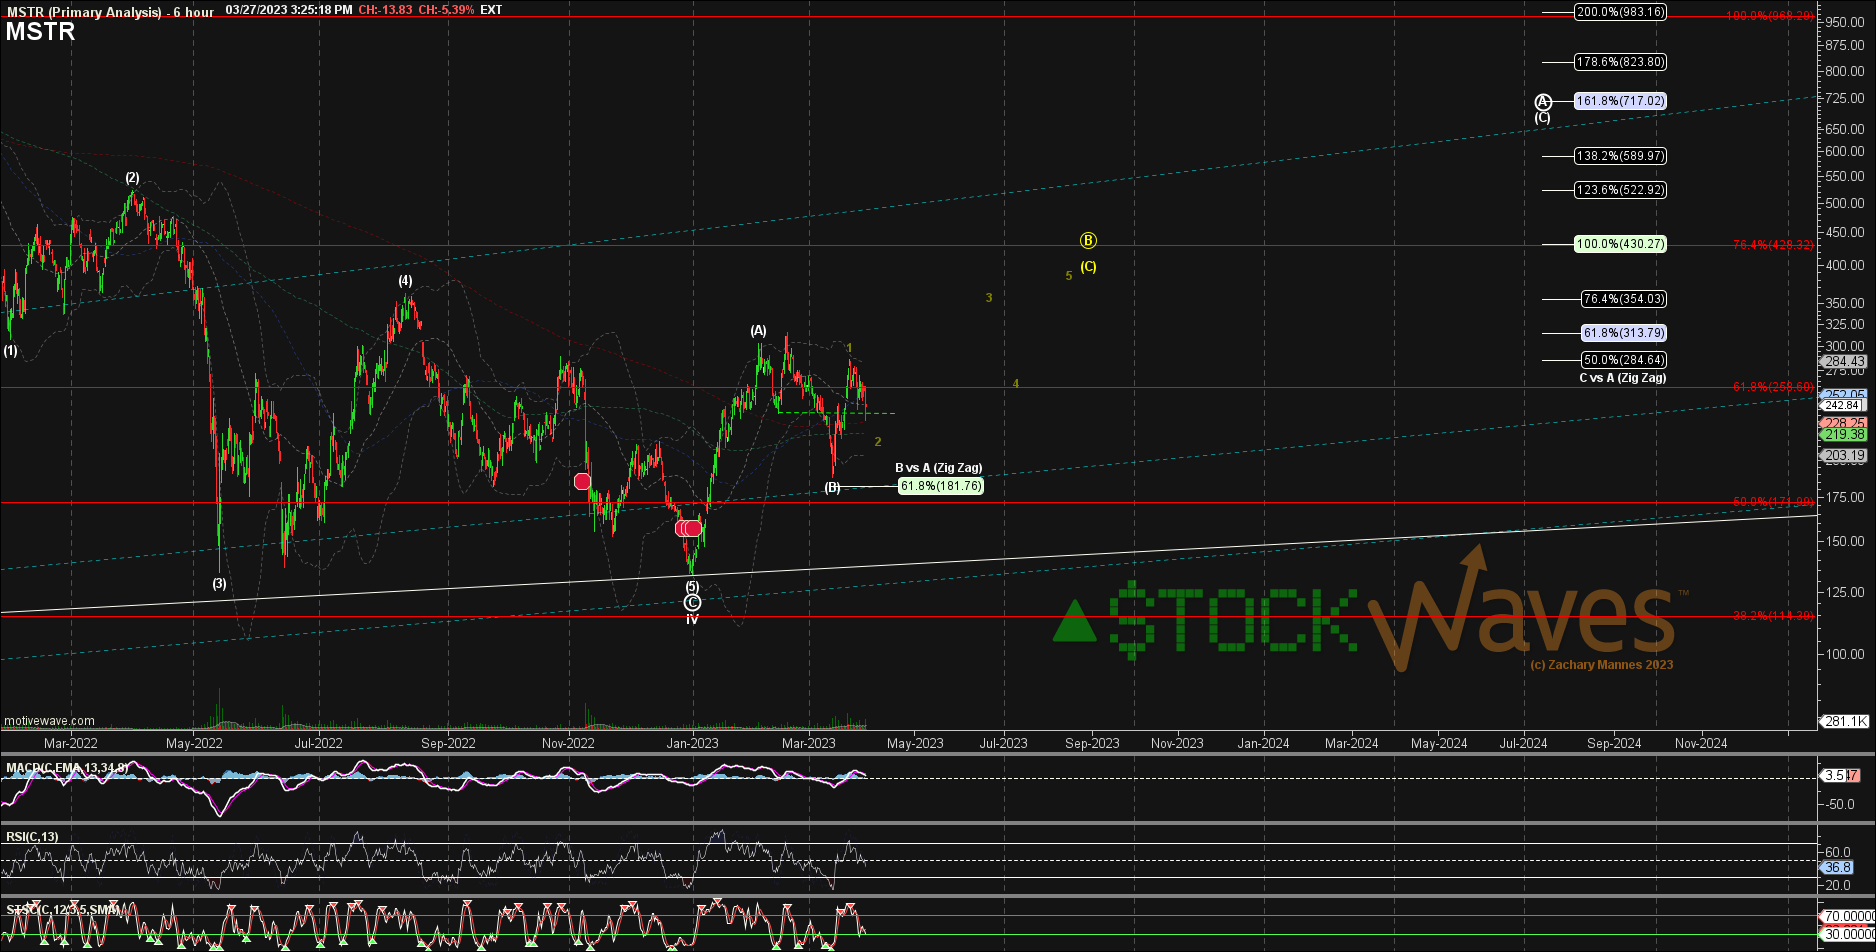
MicroStrategy
The business analytics and bitcoin company, MicroStrategy (MSTR), finally has a rather constructive chart in place.
Garrett’s chart:
Zac’s chart:
The stars are aligning well for bitcoin and bitcoin proxies. The market is currently pricing in peak Fed hawkishness, as they now have to balance between financial stability and clamping down on private sector credit creation. A lot of leverage has been washed out of the bitcoin ecosystem, and on-chain indicators look good.
The HODL wave measures the percentage of bitcoins that haven’t moved on-chain for over year, and currently is at all-time highs which is generally a sign of a deep bear market capitulation being over. This means that not a lot of new buyers have been coming in, while existing holders are gripped on tight to their coins:
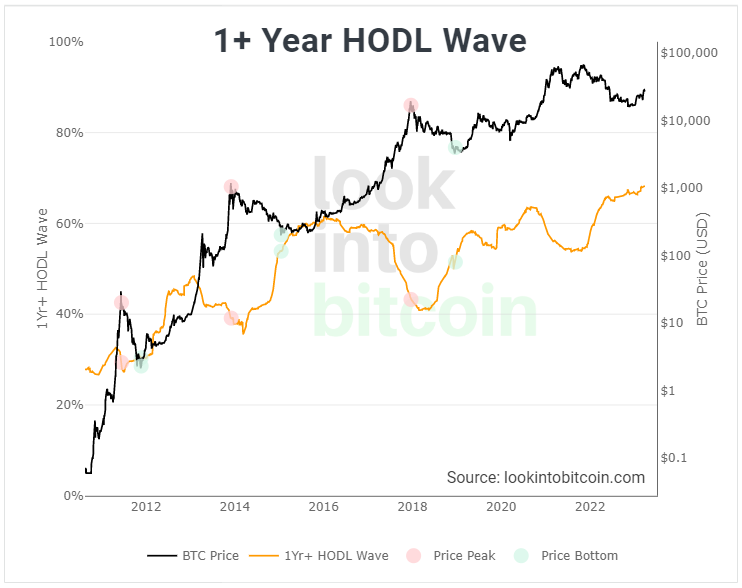
Both the HODL wave and bitcoin price moving up together has historically been a good sign. During the 2016/2017 bull market, the price proceeded to ramp up rather consistently. During the 2020/2021 bull market, the price consolidated through much of 2020 (including a brief-but-violent crash down during the COVID crash) before eventually rocketing higher.
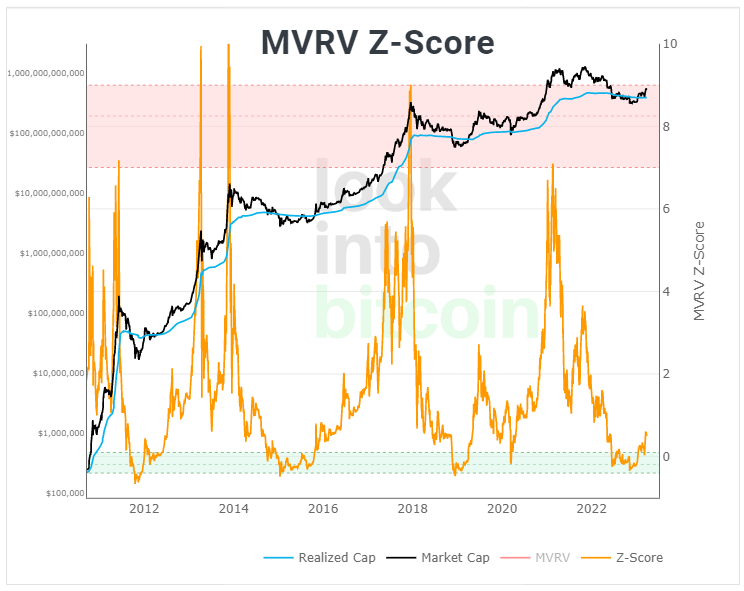
Similarly, bitcoin was below its realized price (average on-chain cost basis) and has recently come back into positive territory, which has historically been an appealing bottom indicator:
I have no idea what will happen pricewise over the next year or two, and I err on the side of conservatism, but overall I’m quite bullish. MicroStrategy is well-positioned to rally alongside bitcoin, if bitcoin indeed does rally.
Walmart
Walmart (WMT) currently has a lower earnings yield (and much lower dividend yield) than a saver can get with T-bills. The valuation is just not very attractive for a stock with its lackluster level of growth:
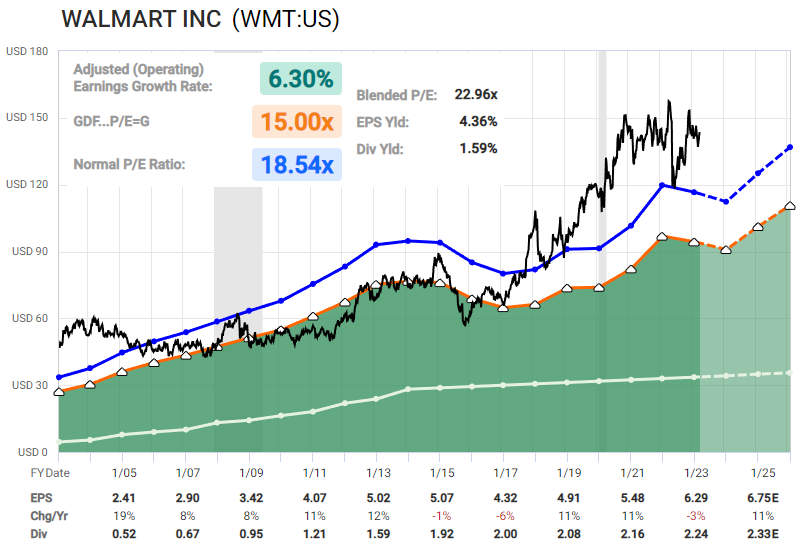
Chart Source: F.A.S.T. Graphs
Valuation alone is not a great catalyst for price action. There’s nothing stopping Walmart stock from chopping along sideways for a while, edging up slowly, or falling. It’s not as though it’s in a bubble, in other words. Its just not attractively priced relative to analyst expectations, and therefore would likely have to greatly outperform analyst expectations to be interesting, which is unlikely. They face a the prospect of a sluggish economy and ongoing tightness in the labor market, especially among blue collar workers.
Zac has a rather bearish chart in place for this year:
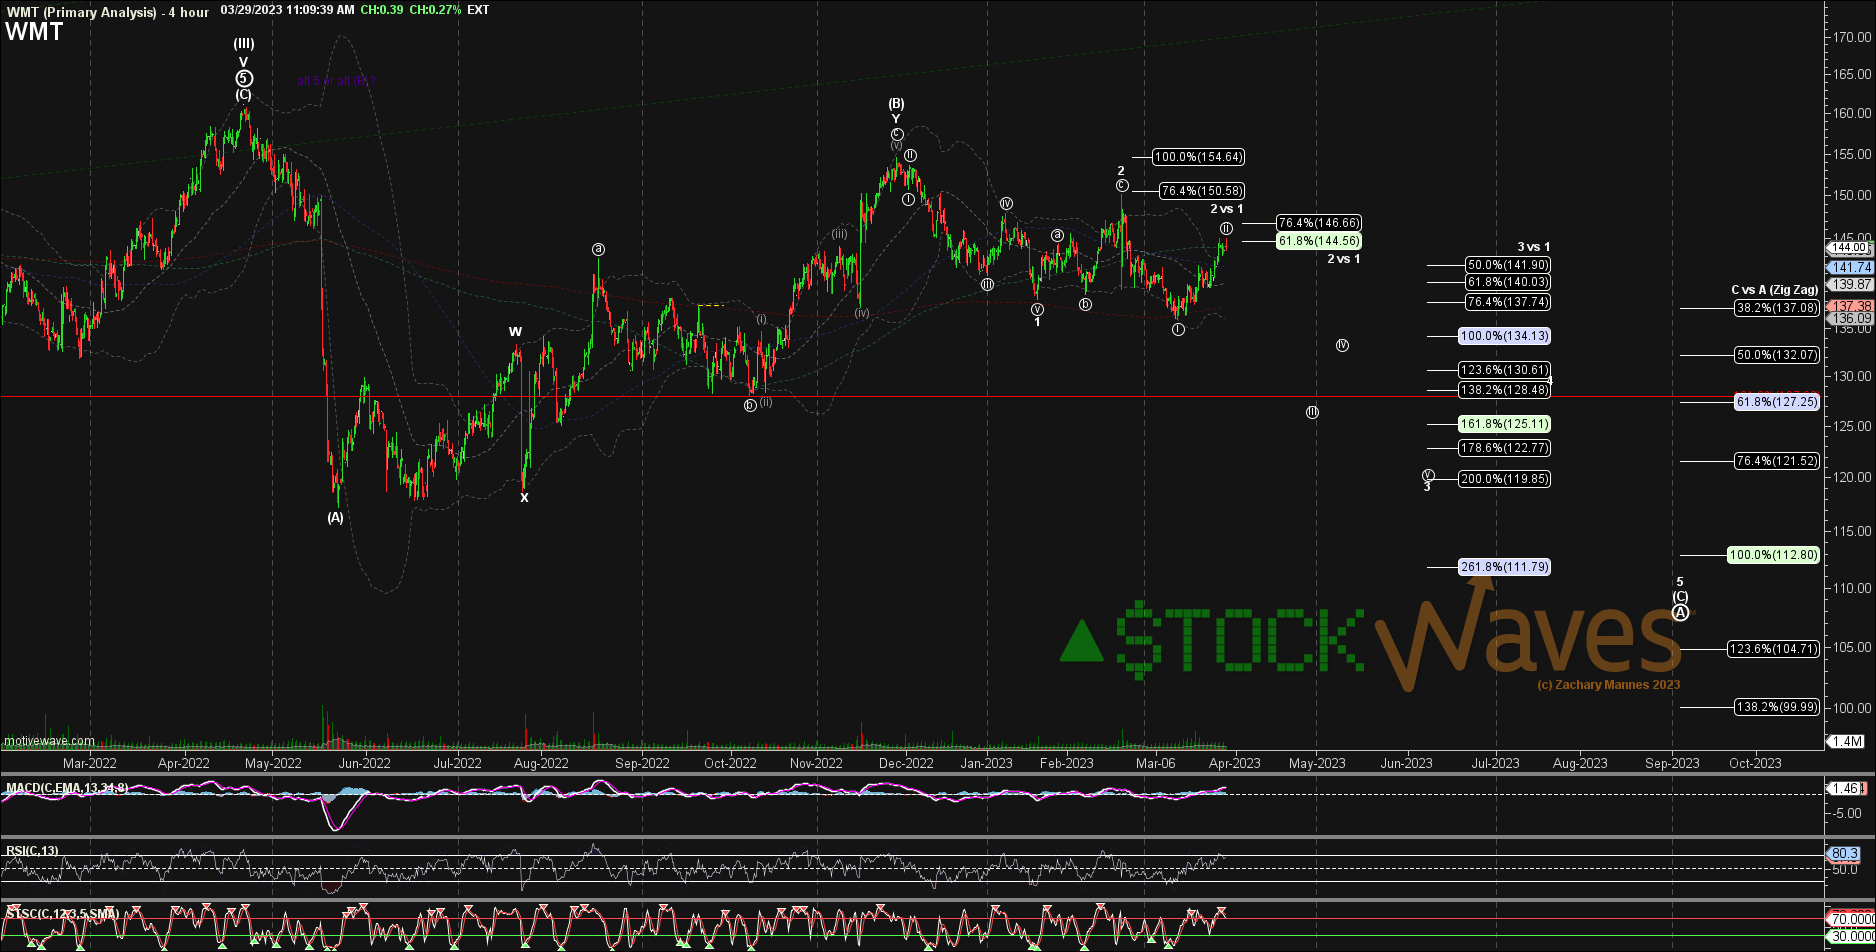
I have no idea if it will dip down that low or not, because that’s a sentiment+liquidity question more-so than just a fundamental question. But valuation, earnings expectations, and technicals do all point in the bearish direction for the moment.
