Wave Counts for European Markets
 By
By
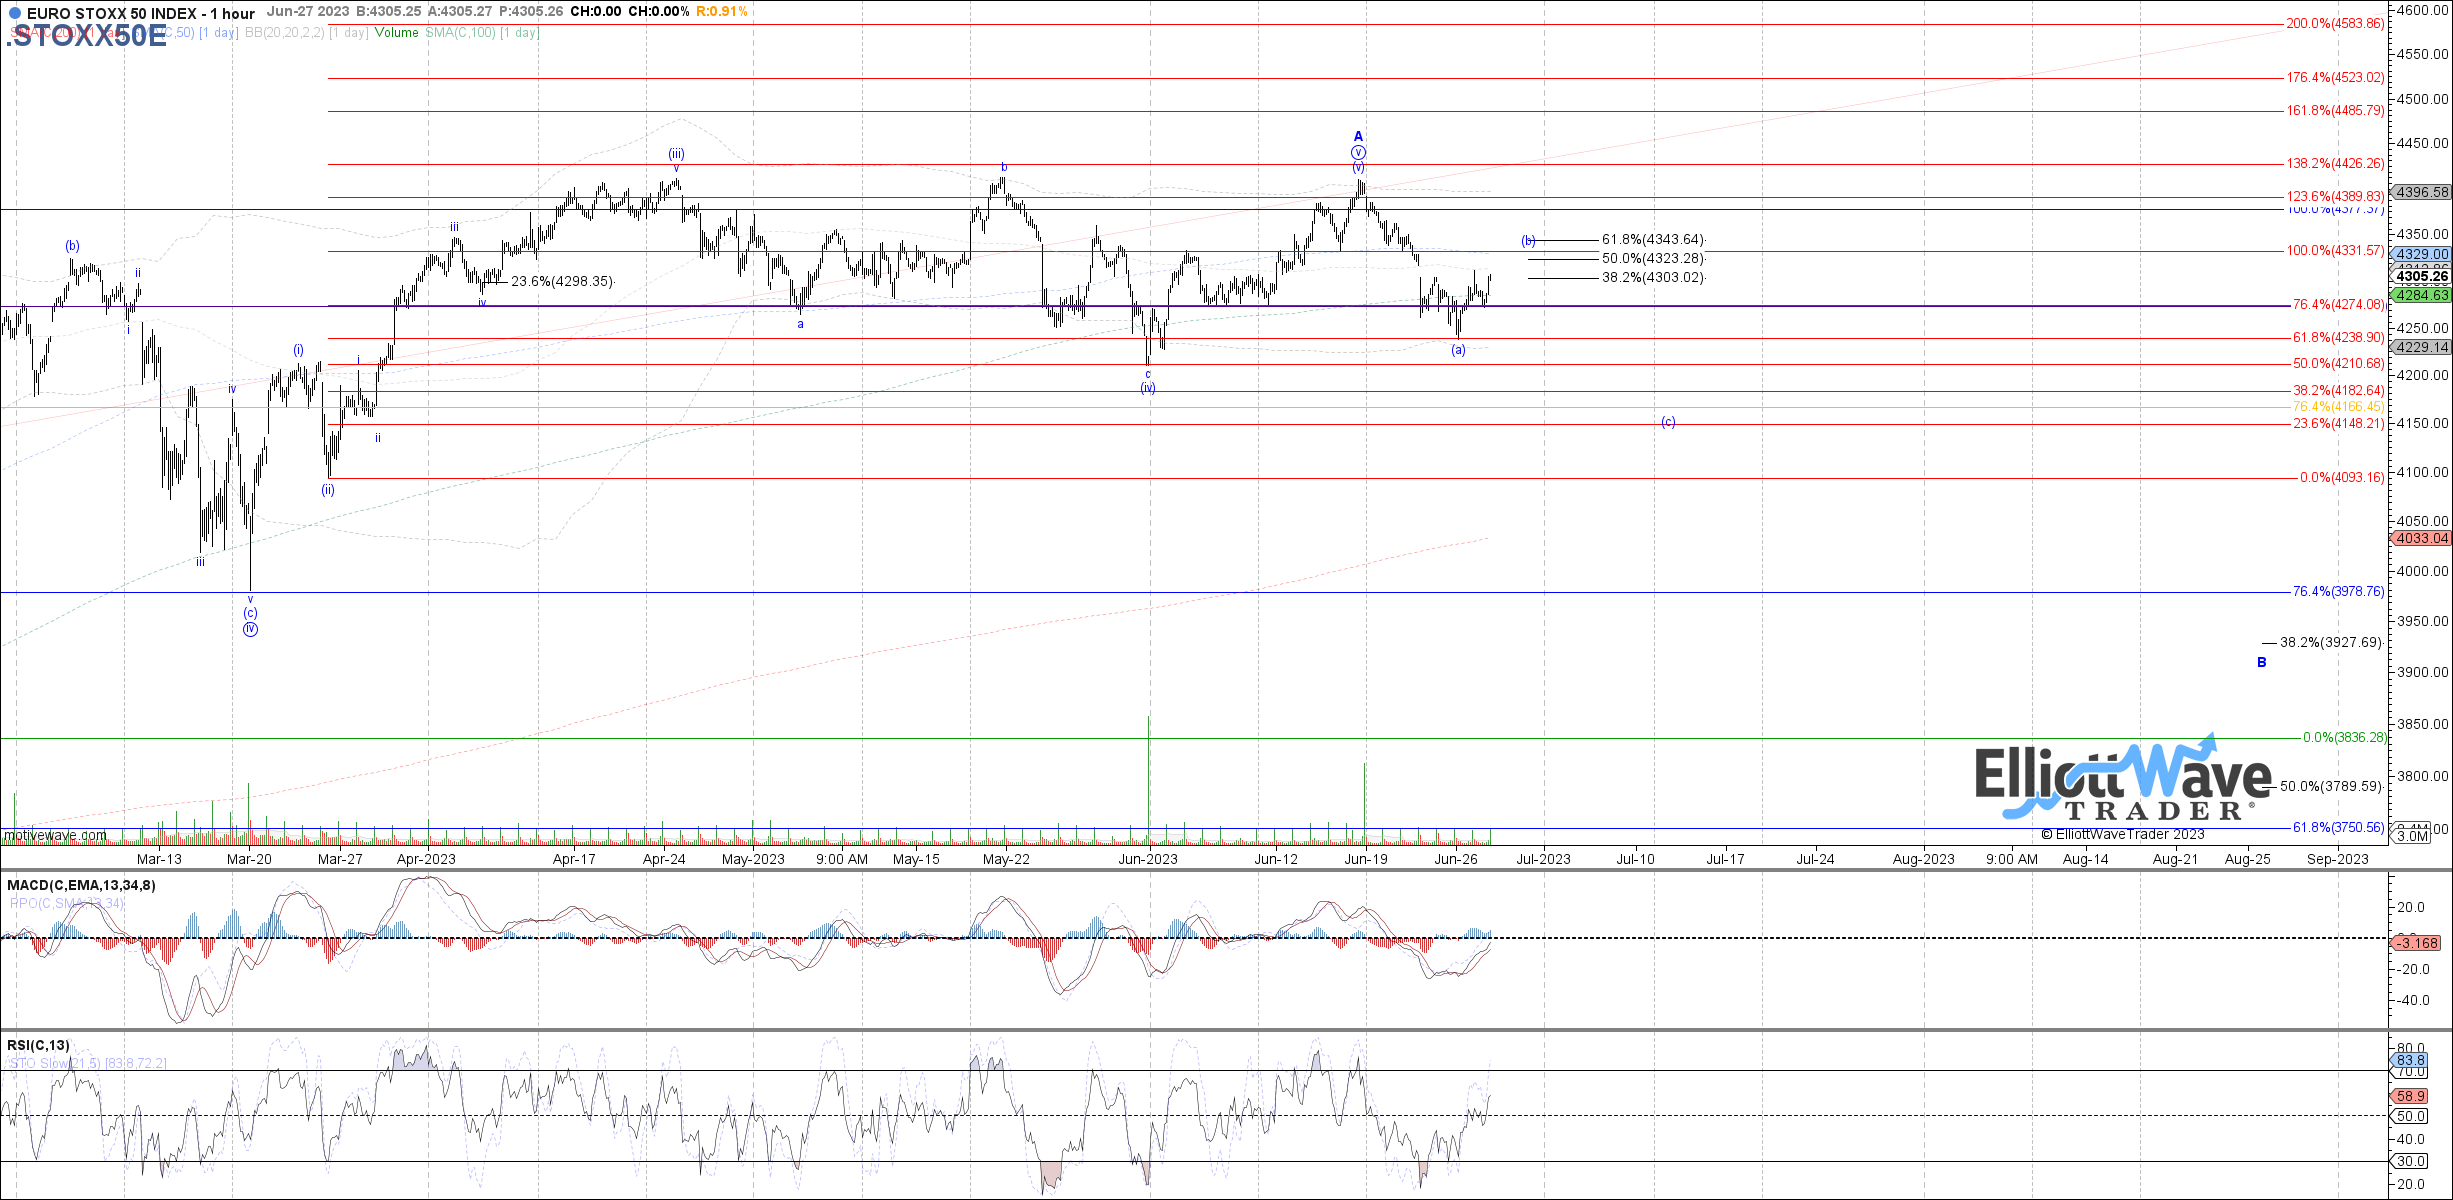
The EURO STOXX 50 Index traded higher today, looking like a (b)-wave bounce filling out as discussed. Based on that expectation, 4345 is ideal fib resistance to maintain below as wave (b) in order to turn price back down again in a measured move (c)-wave. Above that resistance does not invalidate the blue wave (b), and I don't have a great bullish alternative to offer right now.
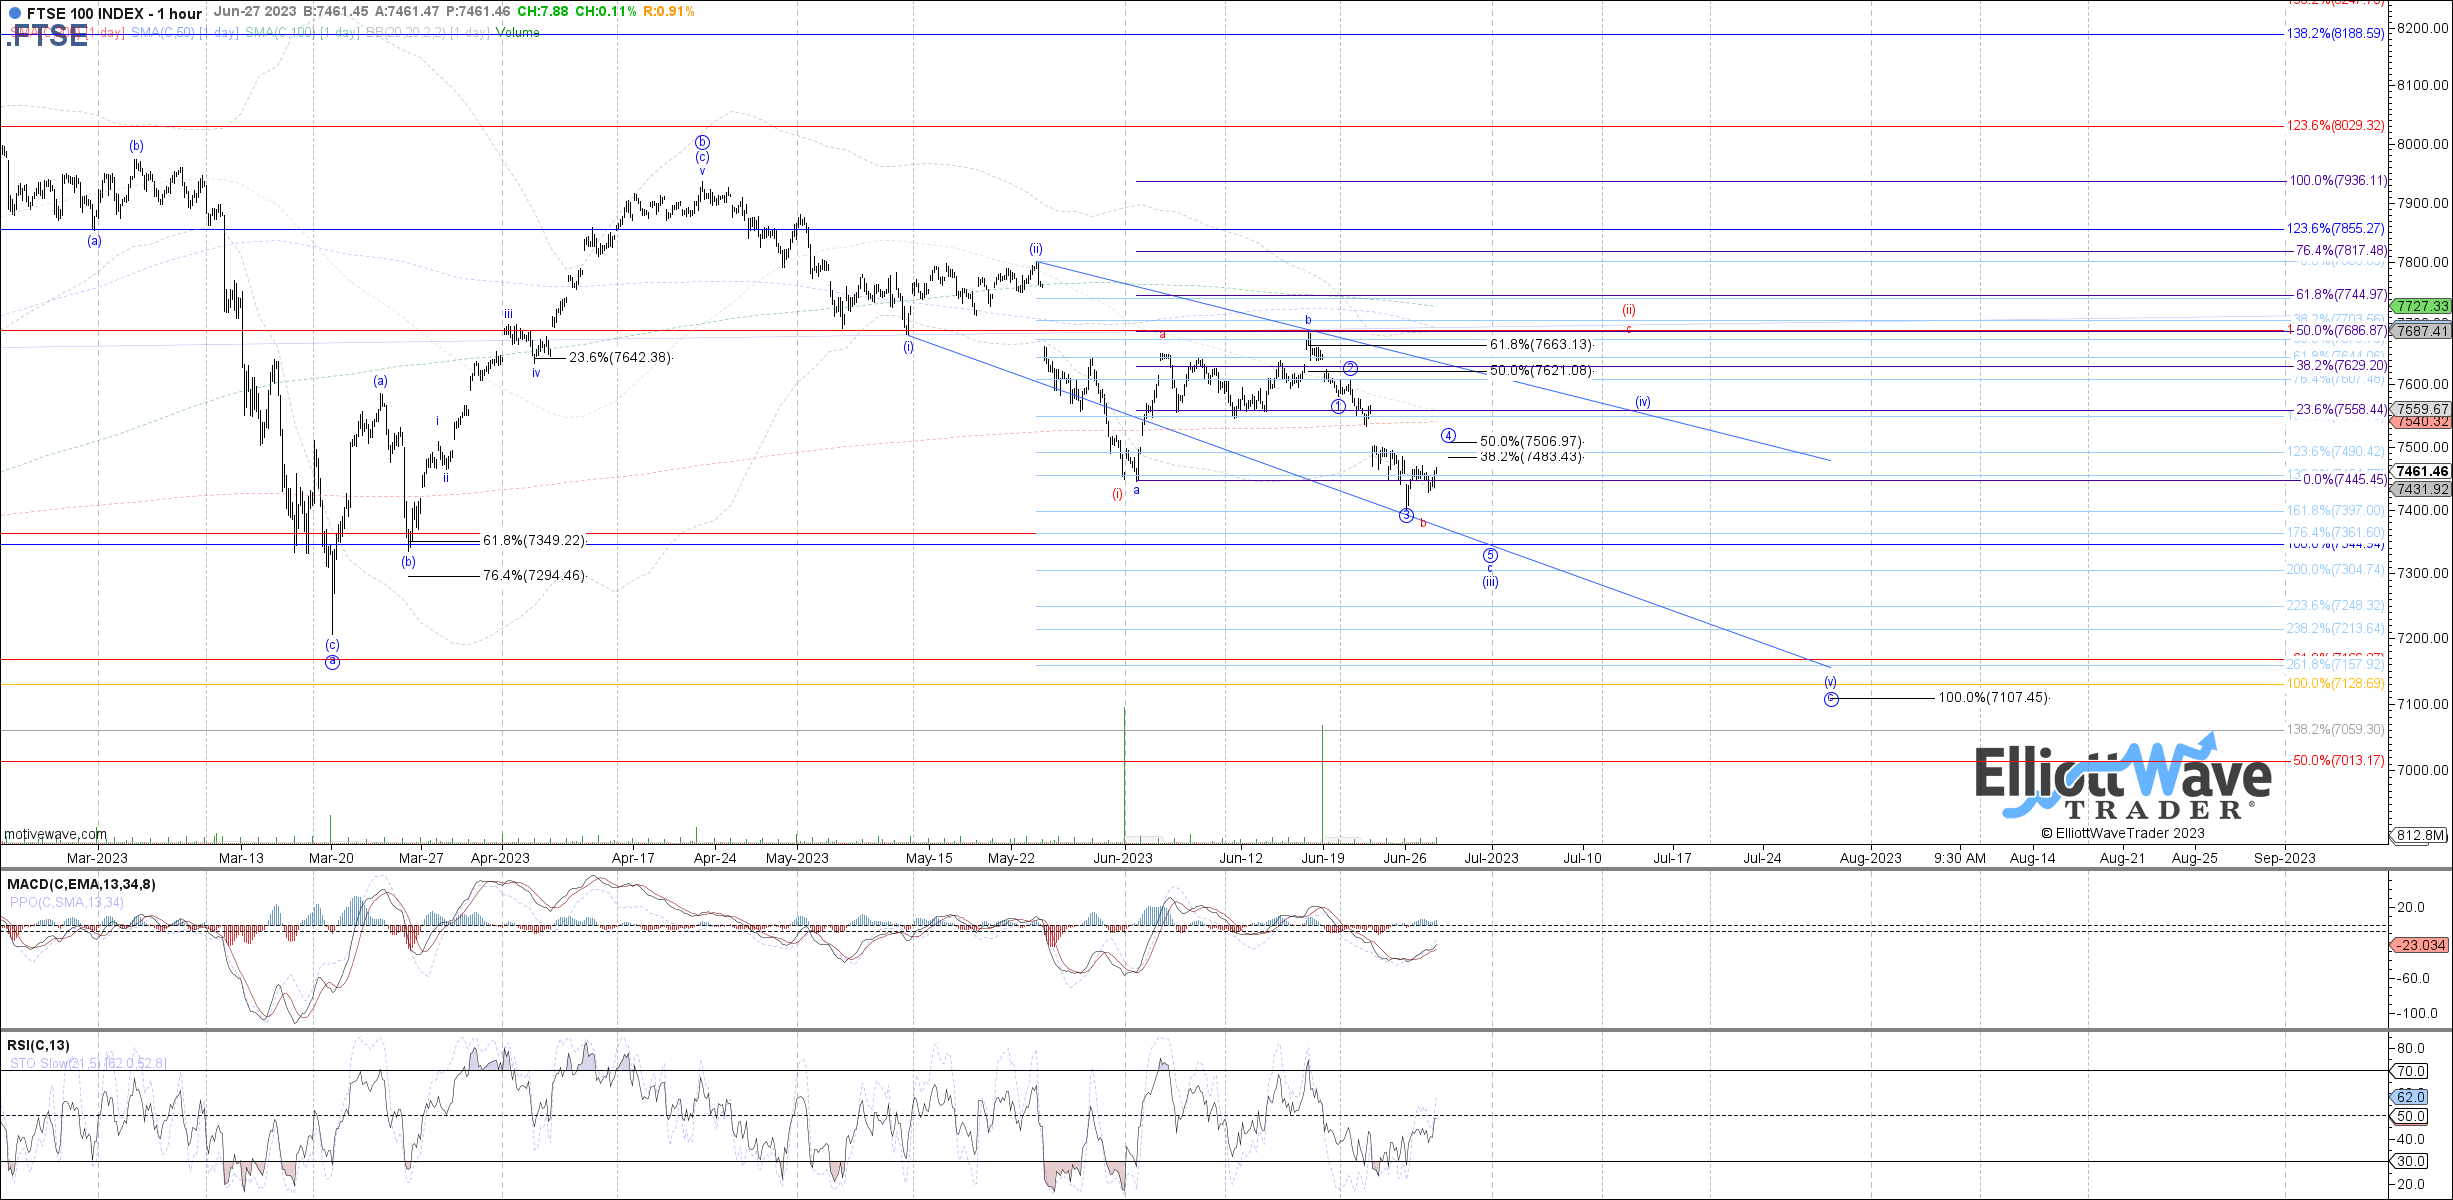
The FTSE 100 was flat on the day, so nothing new to add. Odds of the wider flat wave (ii) in red have been further reduced, but price is still otherwise shy of reaching the expected target for blue wave c of (iii). Therefore, if this bounce is a 4th wave in wave c of (iii), 7480 - 7505 would be ideal fib resistance to hold below in order to make at least one more low as wave 5 of c.
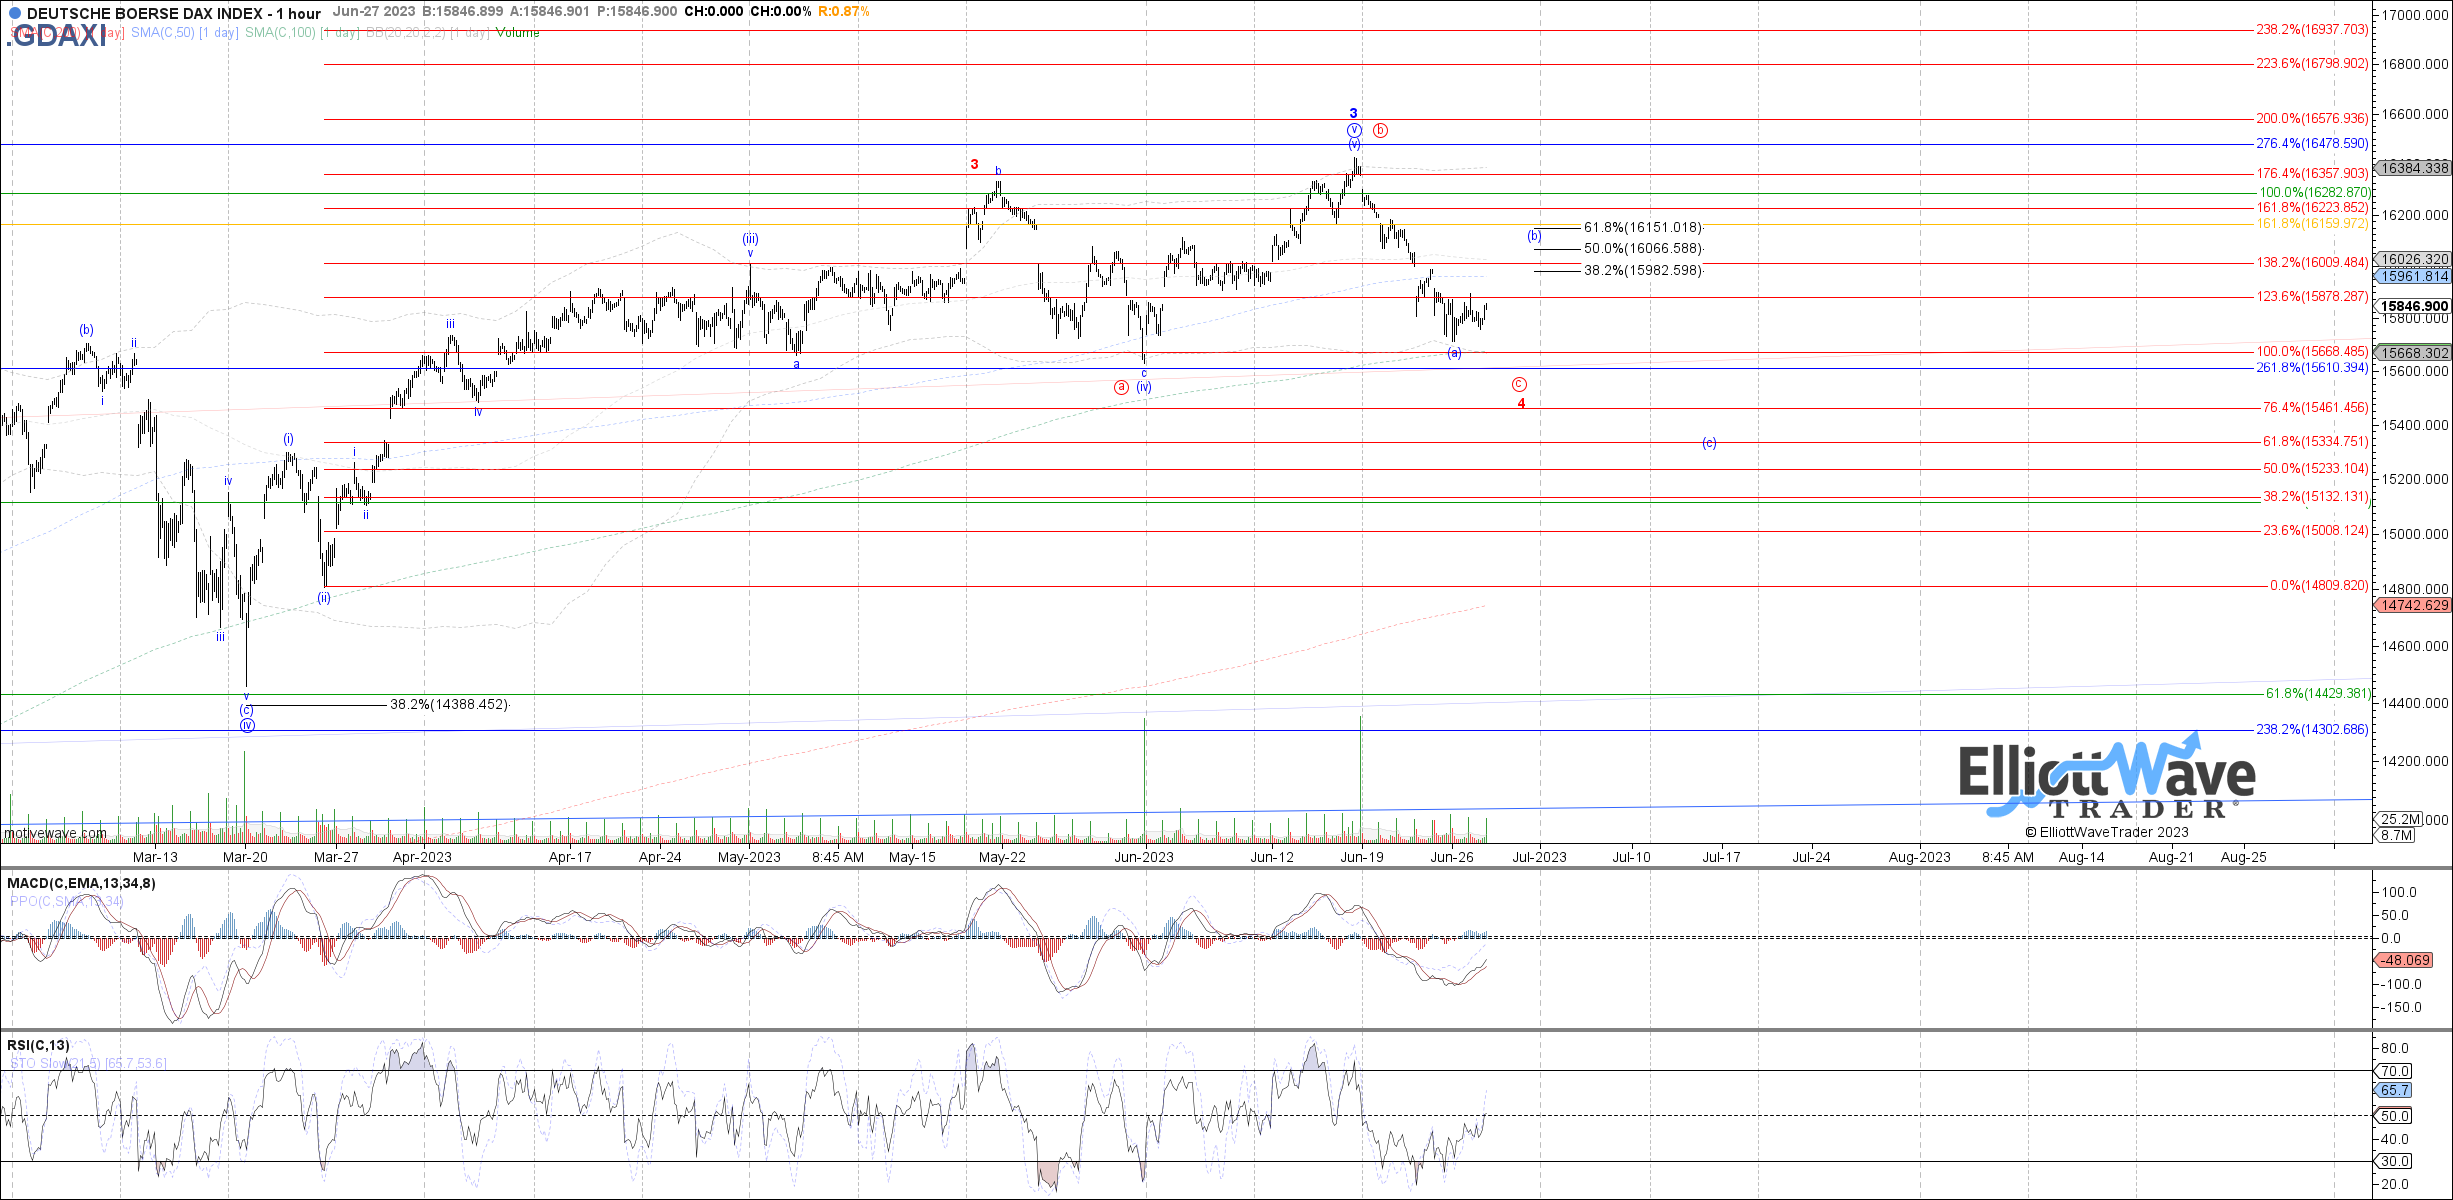
The DAX was also flat again today, so still nothing new to add yet. Price rolled over last week, failing to hold support cited for wave iv of (v) and therefore suggesting that a more muted wave (v) already completed at the current high on the month. Based on that expectation, price should be starting the next higher degree corrective pullback as blue wave 4, with the potential for price to be nearing completion of an initial (a)-wave down from the high. The only bullish alternative to consider at the moment would be an expanded flat off the May high, but that is not my expectation at the moment.