Was Wednesday an Important Top?
 By
By
The market once again followed through on our analysis last week.
We noted: "The strength we saw last week is likely to carry on into this week at least in the beginning. And then we should see some topping action into OPEX on Thursday. And then we should see some topping action into OPEX on Thursday. 2915-20 is resistance. I expect us to clear this and make a run for the 2940-50 area which has high odds of being some kind of top. It will fit well for a top to form in that area sometime around monthly OPEX which is this coming Thursday. And for us to finally begin some kind of pullback from there."
What actually happened: We got continued strength into Wednesday, hitting a high of 2923.5 before selling off from there.
What next?
We tried to clear the 2915-20 zone on the Emini S&P 500, but it rejected from just above and sold off right back into and below the zone. And there was some pretty good volume off the top. This does suggest a decent chance that the top on Wednesday was important. However as we have also seen many times, bulls can always come back with a bang and take the market much higher than we expect. As of now, I am viewing that 2923.5 top as important but if we clear it, we should get up to the 2945-50 zone we were looking for last week which could be an important top.
But same as I said last week: "Remember however that this is just speculation for now and we should have no plans to attempt shorts unless our mechanical models actually tell us to do so. Most market participants ignore what the market is doing right now and try to look at what it might do in the future often without any real reason except that it has gone too far in one direction.. our Smart Money room models tell us what is the path of least resistance right now and we position ourselves with it - this is what makes our indicators and models powerful and worth following."
ES Grey Zone areas: On the upside, we have resistance at 2919-24 but we are also in a zone right now at 2909-2912 - but this one is minor. Above, not visible on this chart, we have major resistance area at 2945-2950 area. On the downside, first support is at 2894-2889 and then 2878-74.
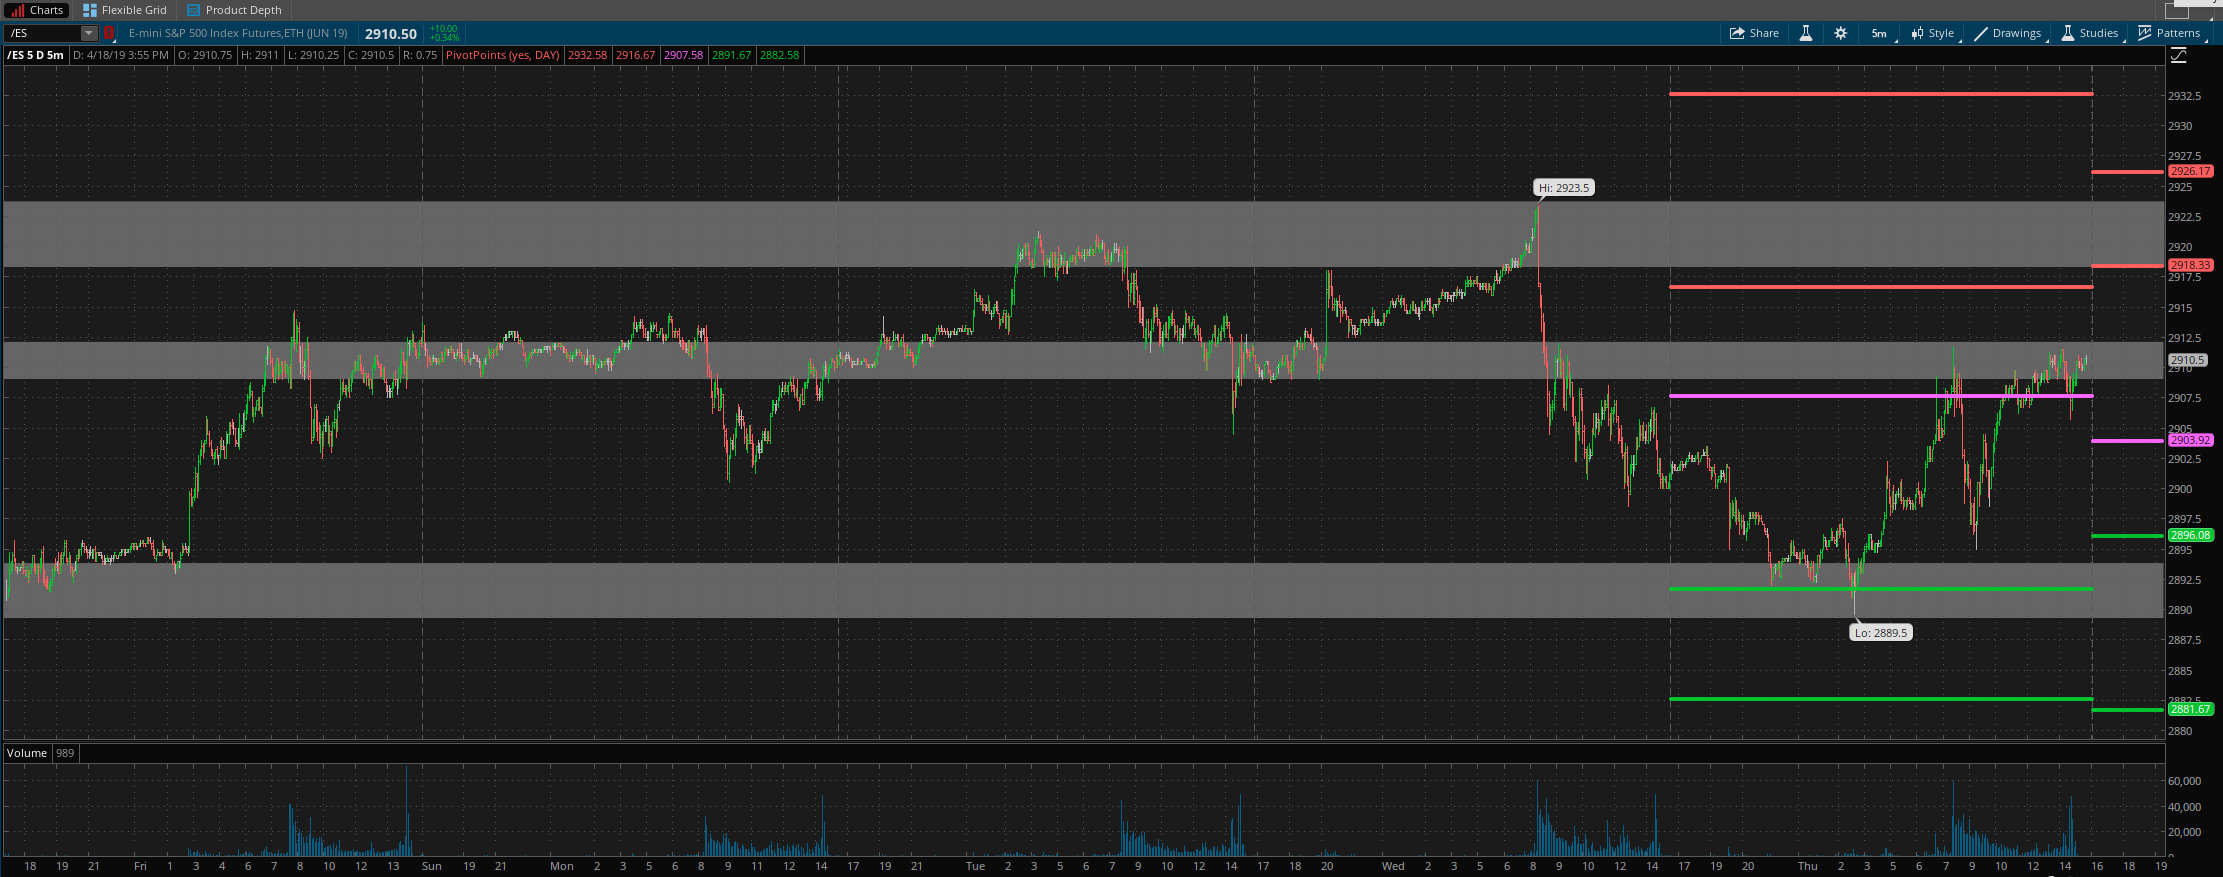
ES daily pivot is at 2904. Resistance R1 is at 2918 and R2 is at 2926. Support S1 is at 2896 and S2 is at 2881.5.
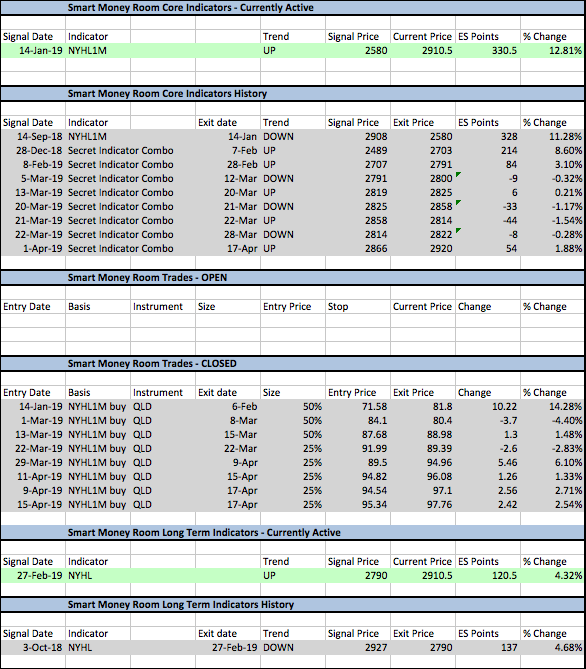
Here is a snapshot of the Smart Money Room Indicators and Trades. Green is active. Grey is closed.
All the best to your trading week ahead.
