Very Brief Window Of Opportunity For Bears
 By
By
In our report last weekend, we noted: "Based on everything we track, I think it is reasonable to expect this correction to continue for some more time - but this is likely to just be another pause to refresh before we can move back higher. On the upside 2987-92 is resistance - if this level can be cleared in coming days, odds increase that correction is over. On the downside, 2954-46 is support and this needs to be broken for next leg down. On the whole, both bull and bear sides appear to be more or less evenly balanced at the moment with maybe a slight edge to the bears."
What actually happened: We tested resistance early in the week, and then the 2950 support area on the Emini S&P 500 (ES) broke for a flush down to 2855 before rebounding back to end up at the 2950 resistance area again.
What next?
Our models on the whole are neutral right now. Based on this and price action, we have to be open to the idea that the low is already in on this correction. Bears have a very brief window of opportunity to take control back. A little bit more positive price action will begin to push all our smart money models back to buys on various timeframes. The razzmatazz wave models do seem to suggest we get some weakness in the coming week, so let us see how that develops and if that gives us some opportunities to set up long trades once we get confirmed buys on the micro NYHL1M indicators.
ES Grey Zone areas: The grey zones on the ES 5 min chart below are what I draw in on a discretionary basis. They are support and resistance areas which the market is most likely to react from. If we test a zone from below, it is likely to be rejected and fall lower to test support zones below. If we test a zone from above, it is likely to take support there and begin a move higher. So these zones can be used for intraday trading and/or as entry points for positioning for swing trades. These zones are drawn in based on what the market has done there previously both on smaller and larger timeframes.
Grey zone support now at 2926-20 and then 2896-2890. Resistance zones at 2947-51(in this now) and then higher we have 2987-95.
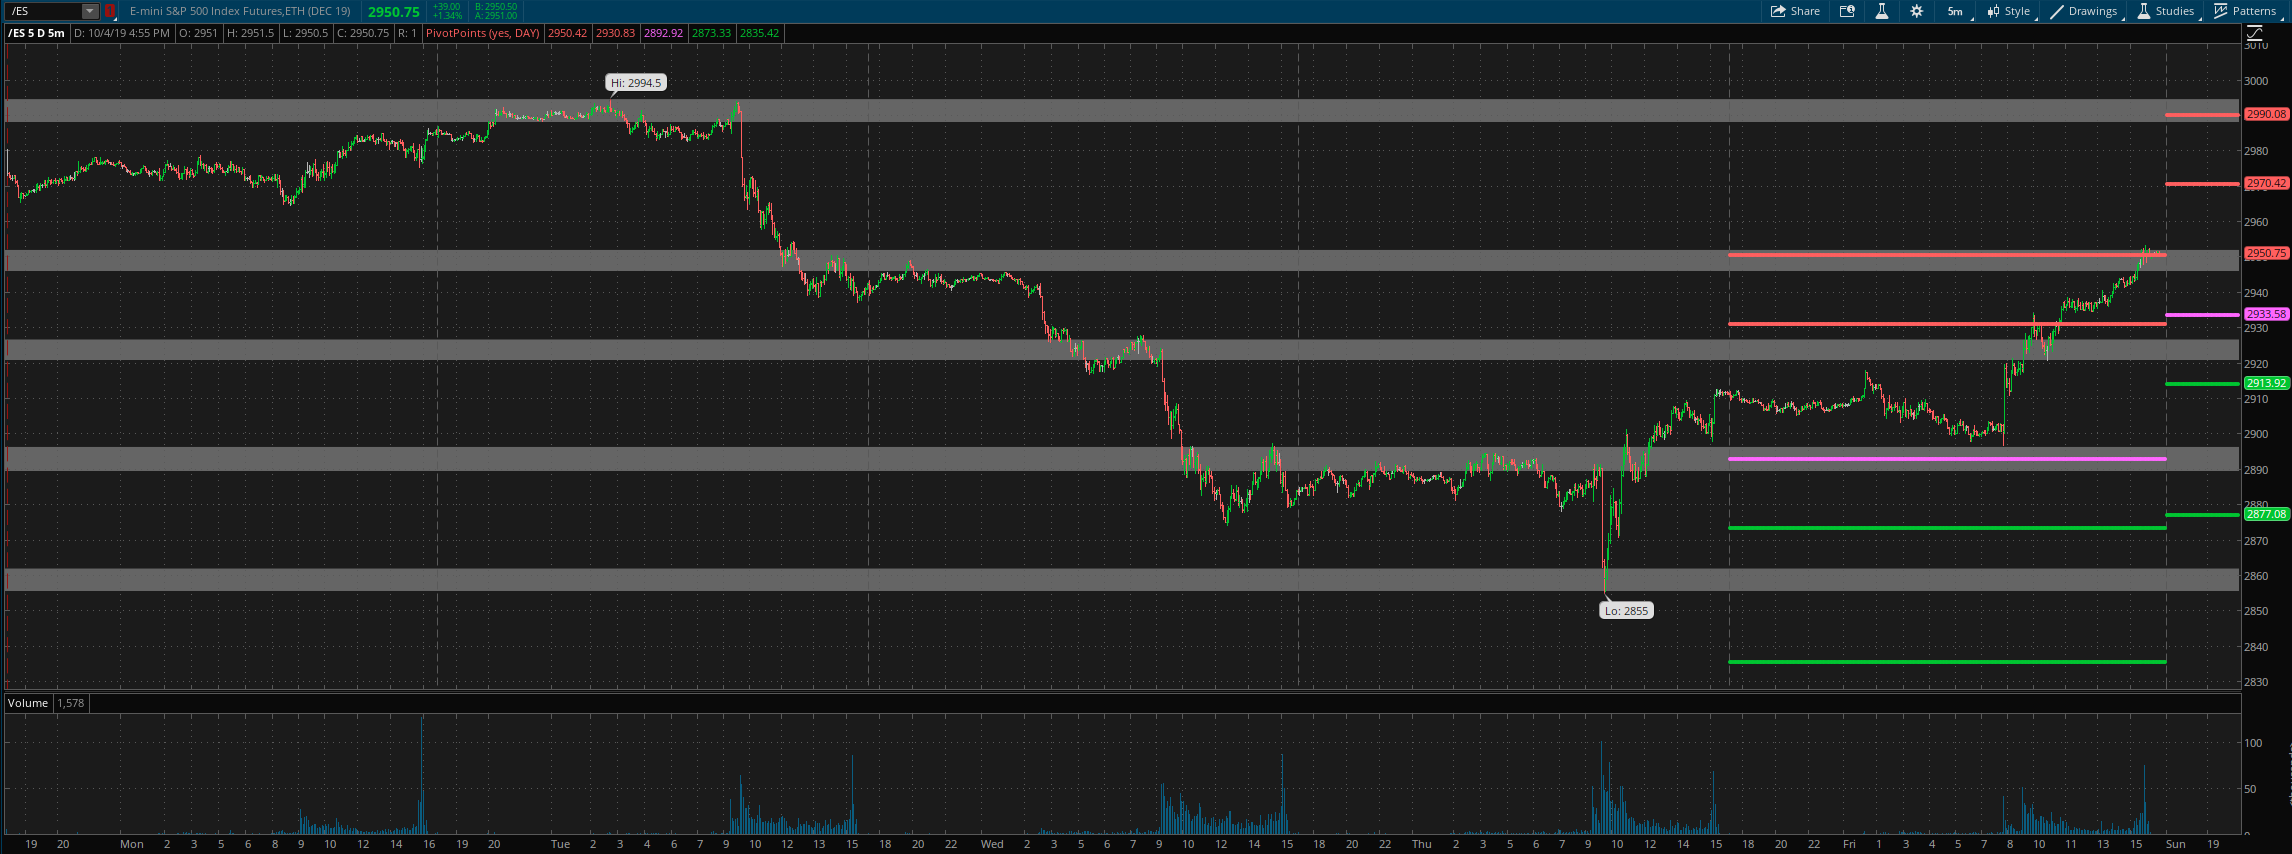
Daily pivot is at 2933.5. Resistance R1 is at 2970.5 and R2 at 2990. Support S1 is at 2914 and S2 at 2877.
All the best to your trading week ahead.
