Upper Hand to the Bears
 By
By
In last weekend's review, we wrote: "Some bearish signs are clearly visible there. Open interest data also looks bearish on our review today. But price is still king and should be given the most importance. Regardless, with all of these warning signs we are seeing in the open interest and internals, we need to be on alert now for a correction being possible sooner rather than later."
What actually happened: The weak internals and open interest data finally caught up with the market in what was a heavily news-driven week, and we ended close to 100 points down over the course of the week.
What next?
On review of our data today, open interest and internals data continue to look bearish. So let us give the upper hand to the bears right now for the short term. Medium term looks neutral and longer term still looks bullish. Possible spots where this correction might end are in the 2800 area on the Emini S&P 500 (ES) and below this in the 2730 area.
Below 2730, we will need to entertain more bearish scenarios. In the coming week, a bounce looks likely in the beginning before rolling over and searching for support lower near the 2800 area. As always, we will continue to use our indicators and data to position ourselves along the path of least resistance in the market.
ES Grey Zone areas: The grey zones on the ES 5 min chart below are what I draw in on a discretionary basis. They are support and resistance areas which the market is most likely to react from. If we test a zone from below, it is likely to be rejected and fall lower to test support zones below. If we test a zone from above, it is likely to take support there and begin a move higher. So these zones can be used for intraday trading and/or as entry points for positioning for swing trades. These zones are drawn in based on what the market has done there previously both on smaller and larger timeframes.
Grey zone support now at 2918-13, then 2896-86. Resistance zone at 2930-35(we are in this now) and then 2953-59 and 2970-76.
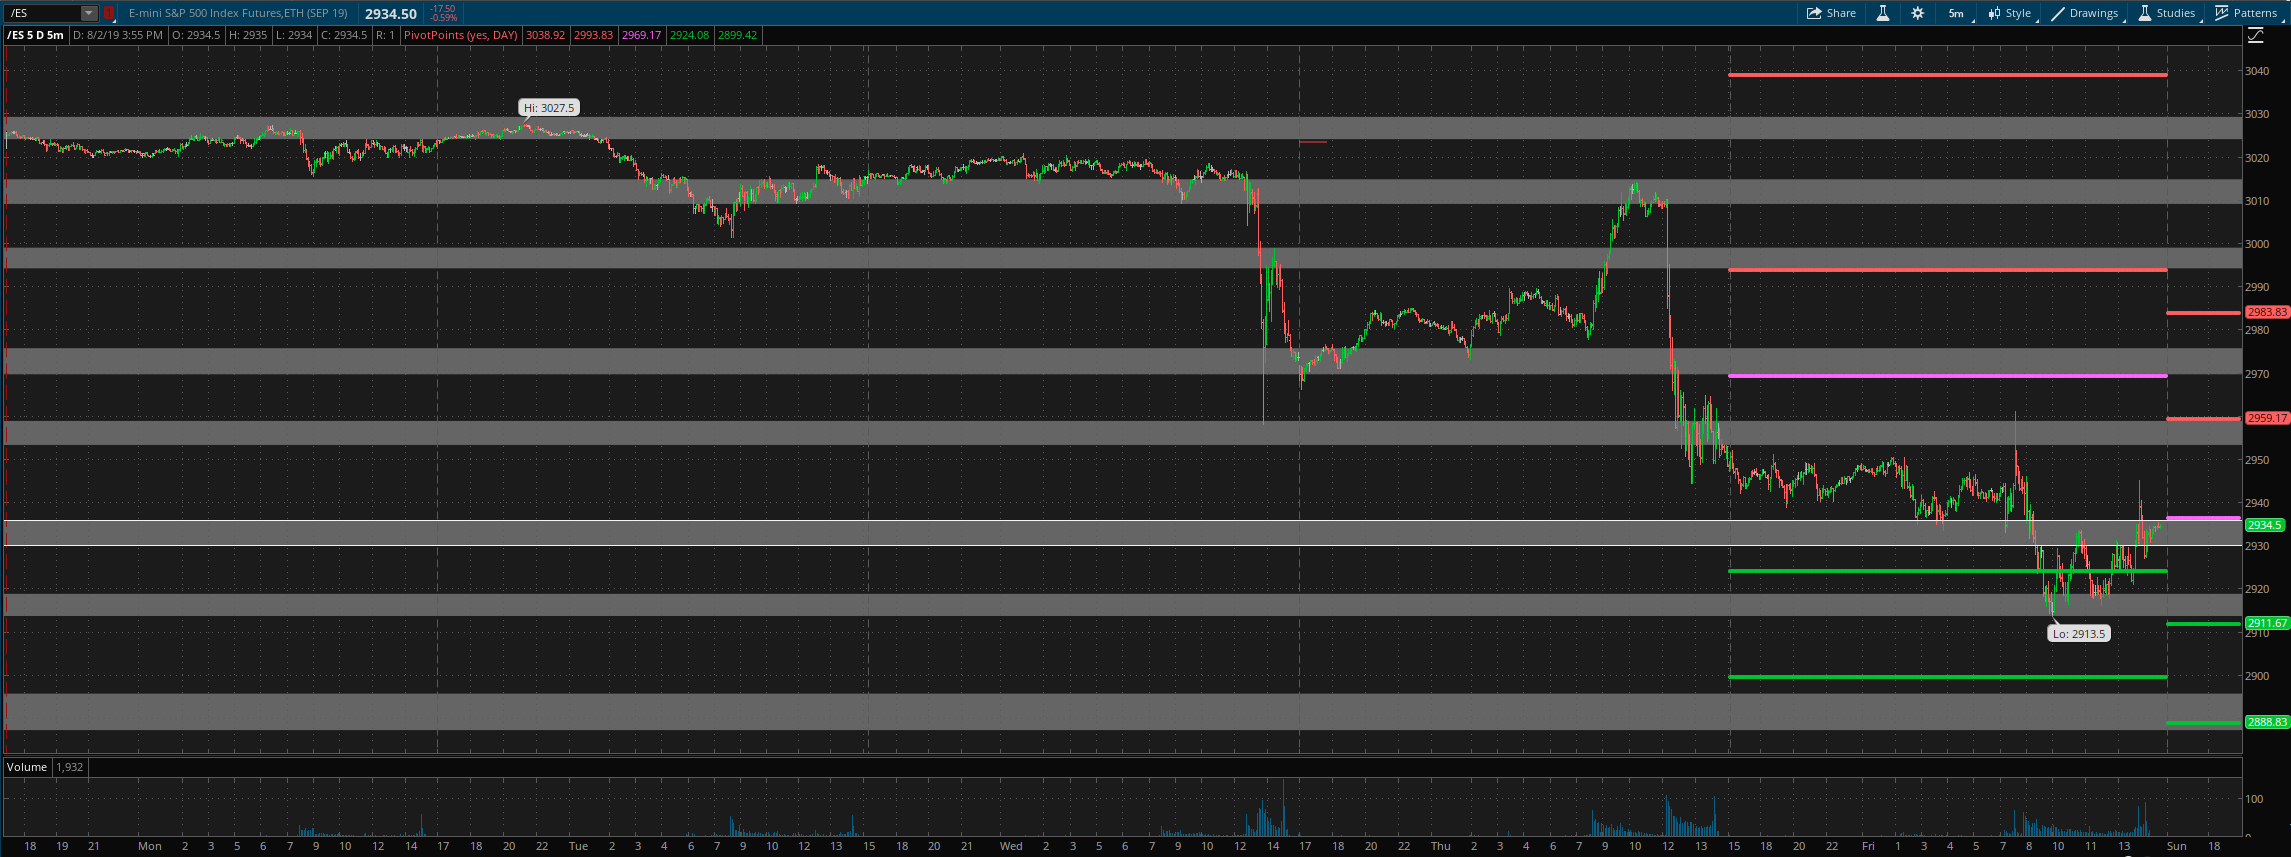
For Monday daily pivot is at 2936.5. Resistance R1 is at 2959 and R2 at 2984. Support S1 is at 2912 and S2 at 2889.
All the best to your trading week ahead.
