Uncharted Territory In The Market
 By
By
In last weekend's report, I noted: "Our indicators continue to support partial long positions so we hold until that changes. I am looking for somewhere in the 4060-4100 area before a bigger pullback happens."
What actually happened is we tested 4021 on the Emini S&P 500 (ES) Sunday overnight and then took off with a brief pause between 4060-80 before ending at the highs by the end of the week.
What next for this week? Options data is bullish on review today. Internals are also bullish though not as much as you would expect to see at all time highs. Price action is short term bullish, medium term neutral and long term bullish. We continue to hold longs via the M2 and Complimentary Systems. Primary stays flat with no support from the Odd indicator and the Long Term Portfolio stays at 50% long.
It was another strong week for price with the market ending well above earlier all-time highs. Our indicators continue to support partial long positions so we hold until that changes. We are now in uncharted territory in the market and so it is tough to say where this may face resistance and begin a pullback. But there is a longer-term trendline that comes in at the 4150-70 area on ES. I think there is a decent chance for us to pullback from this area or even slightly lower to test the 4000/3950 breakout area again. Remember always that these price projections as just scenarios I see as possible right now and they will change as new information comes in. For now, bulls have full control and we continue to hold longs until our indicators suggest otherwise.
Grey zone resistance is in the 4128-37 area and then in the 4150s. Support is at 4105-97, 4077-68, 4056-48, 4032-21 and then at 4005-3994.
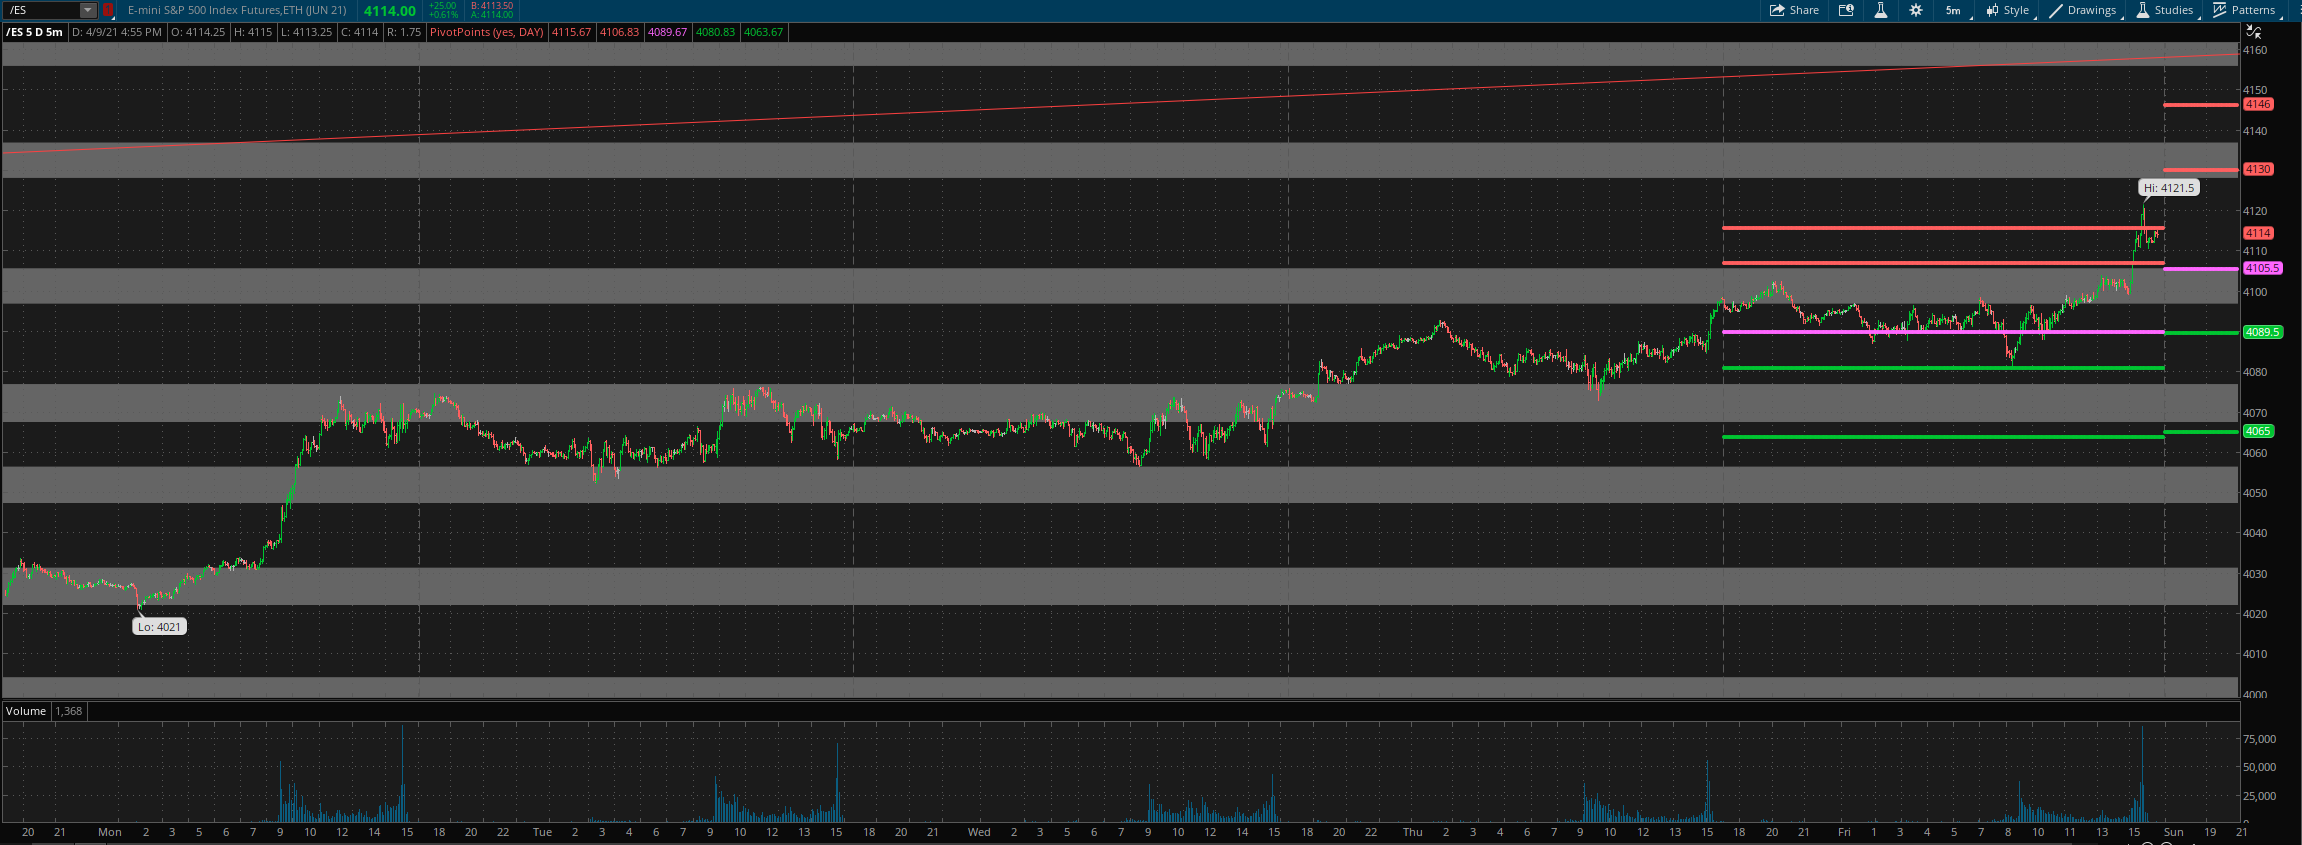
For Monday, daily pivot is at 4105.5. Resistance R1 is at 4130 and R2 at 4146. Support S1 is at 4089.5 and S2 at 4065.
All the best to your trading week ahead.
