Trader Metrics - Market Analysis for Apr 26th, 2019
 By
By
Trader Metrics
Building on the Trading for a Living post I wrote last week, I wanted to explore a series of metrics that traders can look at to see if they have a winning system or atleast something that has a chance of getting there. We will look at some simple stuff in this post and move on to some more detailed forms of measurement in follow up posts.
As I mentioned in earlier posts, every trader is different and how you approach trading should gel with your personality. There is no size that fits all but whatever style you follow, you have to approach trading as a business.
For this, you need to know your system/method and the stats behind your trading. The more mechanical it is, the better it will be.
Controlling your psychology/mindframe while in a trade and having stats for your system are very critical elements to success--in both being able to follow a method and to even have a clue whether one has a chance at consistent profitability with low risk of being killed by the market.
You need to have a system.. You need to run stats on your system. And this will create a belief in your system which will allow you to follow the process every single time you see a setup without having to second guess it whenever you see conflicting opinions out there.
What is a system..
It can be anything... but you need to know what it is... and you need to have run some stats on it.
Like the blue boxes…. or wave counts… or a simple pivot based system I outlined a while back…
What I am trying to say is.. it doesn't matter what it is... as long as you have tested it, you have a belief in it's success rate... and you follow it religiously with proper sizing and stops...
So what are your metrics. We will look at some simple ones here and in later posts we can discuss others like the Sharpe ratio.
RR and Win Rate -
Reward-to-risk measures how big winning trades are relative to losing trades. Aiming for higher RR is always good but then trade number goes down. Generally it is good to aim for trades where you can make a possible profit of at least 1.5 times the risk (1.5:1). For example, risking $1000 with the expectation of making $1500 or more. Note that I said ATLEAST. Mostly it is better to shoot for higher reward:risk like 2:1 or 3:1.
The RR should be considered along with win rate. Win rate is how many trades we win out of how many trades we take. If we win 70 trades out of a 100, the win rate is 70%. This statistic is not all that useful on its own, because it doesn’t account for HOW BIG winning and losing trades are. A low win rate can still produce an overall profit if the winning trades are very big compared to the losing trades. The lower the win rate, the higher the reward:risk required to be profitable. With a higher win rate, the reward:risk doesn’t need to be as high for a system to be profitable. Traders needs to find a balance between these two figures to be profitable.
Which brings us to Expectancy -
Trading expectancy is a statistic that combines the win rate and reward:risk ratio. It provides a dollar figure for the expected profit or loss on each trade. Positive is good, and shows that the trading system is producing profitable results. A negative number indicates the strategy is, or will, lose money.
Expectancy is calculated as (% wins x average win size) – (% losses x average loss size).
Lets say a trader wins 60% of their trades. They lose $100 on losing trades and make $150 on winning trades (1.5:1 reward to risk).
(60% x 150) – (40% x $100) = 90 – 40 = $50. For every trade this trader takes, on average they can expect to make $50.
Lets then say another trader wins 70% of the time and makes $100, and on the 30% of losing trades they lose on average $300.
(70% x $100) - (30% x $300) = $700 – $900 = -$200. This trader can expect to lose on average -$200 for each trade they place. Even though the win rate looks good, the losses are too big and result in a losing system
One other important statistic for me is Max Drawdown/ Max consecutive losers. I mention important because most traders ignore this and focus only on when things go well. Every single system OR trader no matter how good it is or they are will have a period where everything seems to go wrong…. You need to always trade as if you have your MAX or WORST drawdown period dead ahead of you.
Monitor how many losing trades you had a row, while still being profitable. This is important for maintaining confidence during the inevitable rough patches to come. If your statistics show that you once had a 10 trade losing streak, but were still profitable overall for the month, that can help you stick with your plan when the next batch of losing trades comes.
This is why it is so important to test a system or atleast know its stats before using it is so important. You need a reference point to operate successfully. For example, a good system may have 4 or 5 losing trades in a row, before a string a good ones. If you do not know this, you may give up after a few losses, missing out on the upcoming profit. It is also important to know these stats so that you are aware that even if its going through a rough patch, the system is in fact operating properly, just the expected rough patch, or when it is no longer ‘working’ and needs to be adjusted.
Maximum drawdown is the biggest percentage drop in capital witnessed while using a system. It is calculated as the difference between a high point in capital and a low point that occurs after - no time restraint on this metric.
A profitable trader may have a bad period and go from 100K to 85K, before recovering all the losses and bringing the account back above 100K. In this case, the trader’s drawdown was 15%. There is your frame of reference and the trader knows that as long as the plan is followed, a 15% drawdown can occur, but is by no means the end of the world. Same as with maximum consecutive losses, maximum drawdown provides a reference point for what size of losses are normal…. It is when it goes out of these bounds that you know something is wrong and needs to be adjusted. Things change… systems need to adapt according to market conditions at times....
One thing every trader eventually realizes is - there is no Holy Grail.. you need to work hard whatever type of system you use and risk management is critical in order to be successful in this business.
Hope some of you found this information useful. We will look at Sharpe and some other stats in upcoming posts.
=========================================
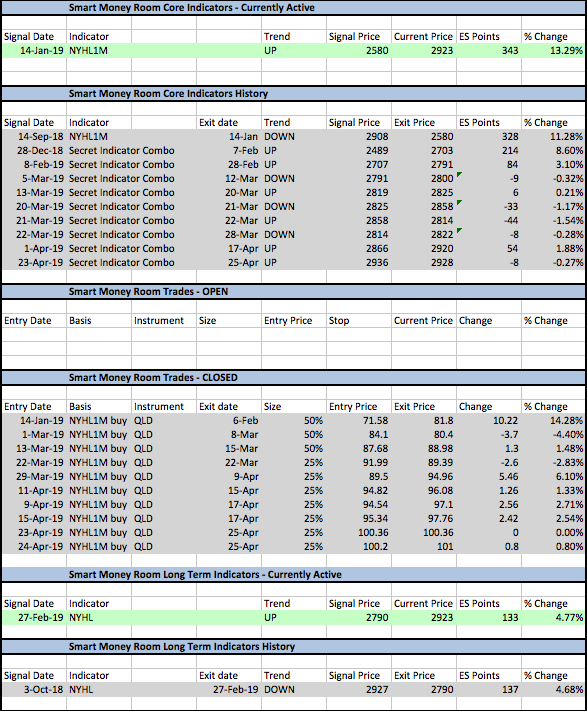
Coming the market this week... While I will put up the weekend report and outlook as usual on Sunday, just wanted to add some quick notes... internals this week are beginning to look ugly to me.. So my guess is that we are getting closer to a top and finally a sell signal on my NYHL1M positional system..
But as I have been saying for last 2 weeks, this is still just speculation for now and we should have no plans to attempt shorts unless our mechanical models actually tell us to do so. Most market participants ignore what the market is doing right now and try to look at what it might do in the future often without any real reason except that it has gone too far in one direction.. our Smart Money room models tell us what is the path of least resistance right now and we position ourselves with it - this is what makes our indicators and models powerful and worth following.
This week we attempted 2 more QLD trades... looked good initially before exiting them yesterday... made 0.8% on one and broke even on the other. As I said above, the posture of internals is not exactly healthy right now.. that can change in coming days... it was real ugly yesterday.. improved a bit today.. Maybe it becomes better next week at which point, the plan would be to re-enter the longs.
Below is a snapshot of the Smart money room trades and indicators as they stand right now..
SO....
This post is about trader metrics... So lets look at one metric of the NYHL1M system...
I.e Expectancy... one the more important once of the metrics.
From above, Expectancy is calculated as (% wins x average win size) – (% losses x average loss size).
Below is the stats of the system from late 2012 to date... Note that this is the main NYHL1M system... not micro as I call some of the smaller timeframe signals I use to trade with at times... The main one's stats are below...
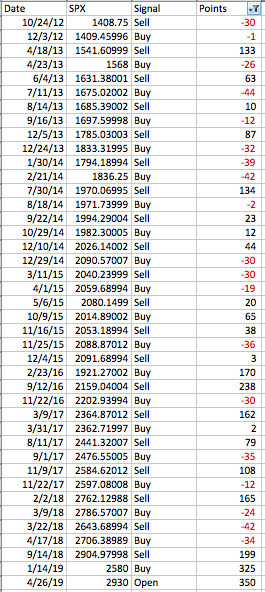
So we have a total of 41 trades out of which 22 are winners and 19 are losers. Most of the losers above are stop outs rather than letting the system exit to completion.
Or a 54% win rate.
Average win points is 110.5 and Average loss points is 27.5
So our expectancy of the system is 54%*110.5 - 46%*27.5 = 47 points.
So your expectancy per trade is 47 points.... or per contract 2327$.
So basically you can make on average 47 points per trade.... or 2327$ per contract per trade...
Once again... like I always say... everything looks great on paper... and there is no holy grail.. this system is working great now... may mean revert in the future... So stops are an absolute must.. as it should be in any system... Without risk management, any trader is headed toward an account blow up eventually... the sooner everyone understands this, better it will be for their account performance...
And lastly, if anyone is considering joining up....rates to the Smart money room go up from May 1st...
For more detail on the NYHL and other systems we use in Smart money : Link to the NYHL Positional System
And if anyone wants to know more about what we do in the Smart Money room, start with this video I did recently -
Have a great weekend all!
