Tops Apparent in Asian Markets
 By
By
ASIA/PACIFIC
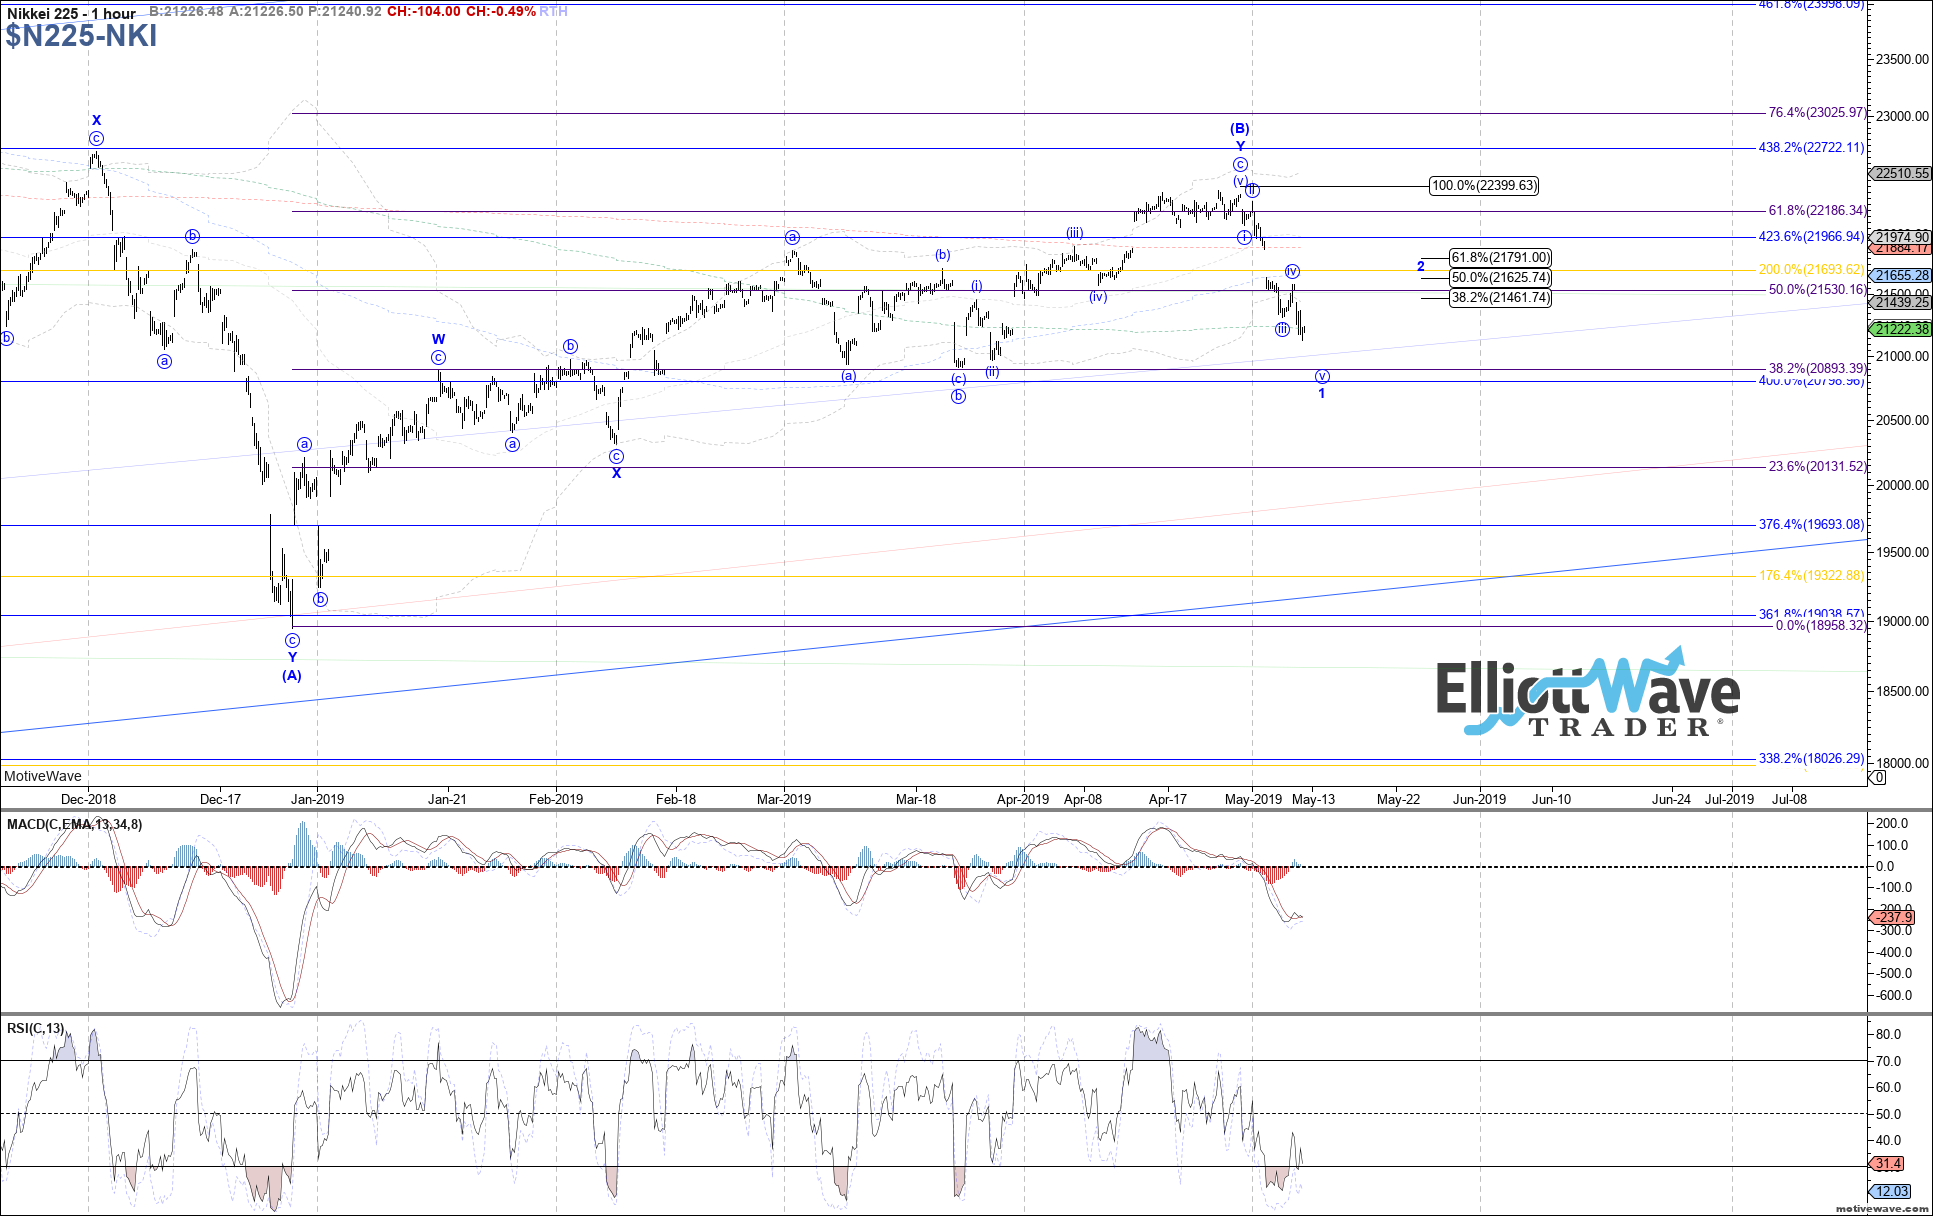
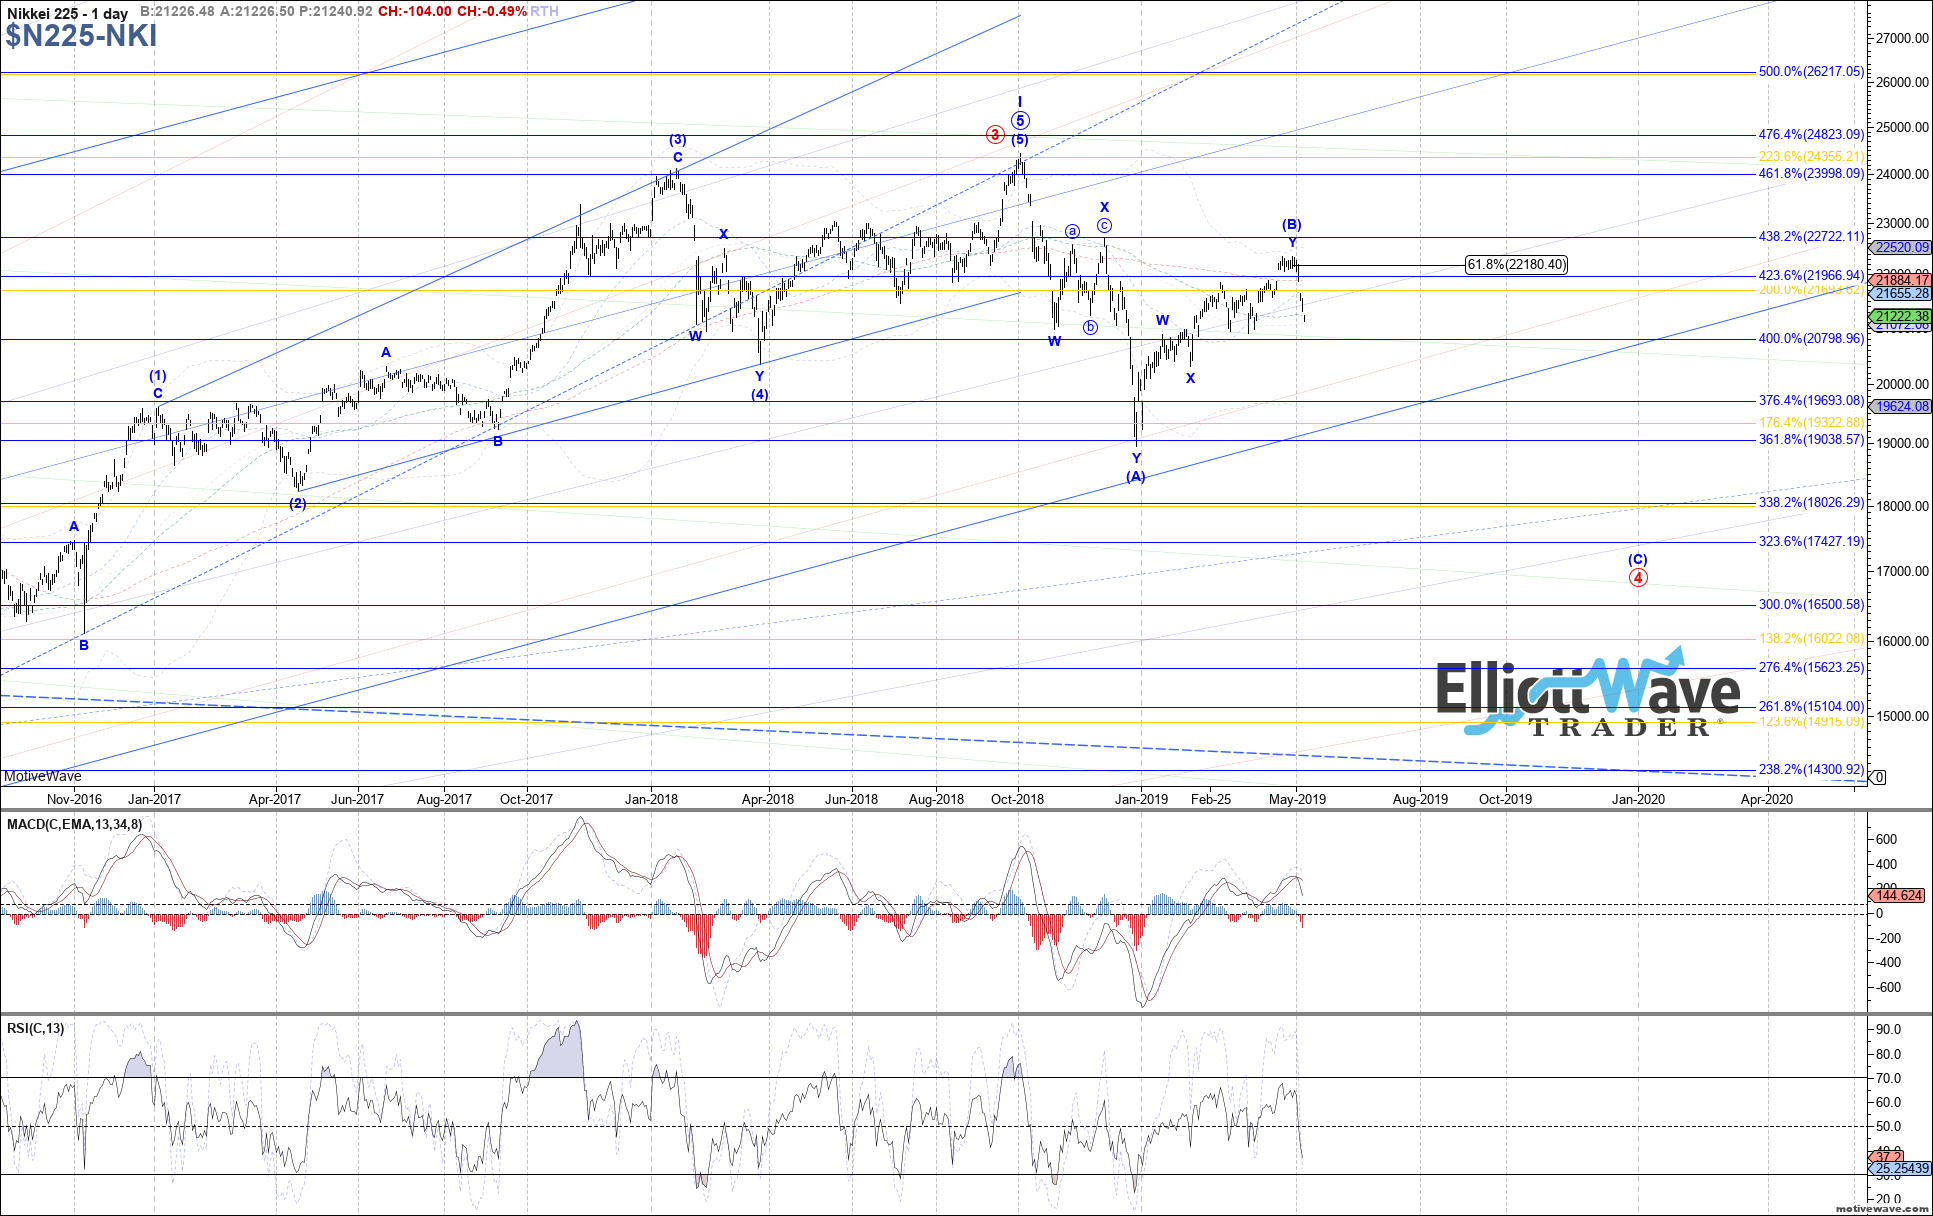
N225: The Nikkei traded sharply lower last week, breaking below all the support necessary to strongly consider a top in place at the April high as wave (B). Price has since filled out what can easily count as 5 waves down from last month’s high, either as an initial wave 1 or A-wave of the next decline. There is still room for a little more near-term downside in wave v of the impulse before bouncing again in a corrective wave 2 or B, with the March lows as current support.
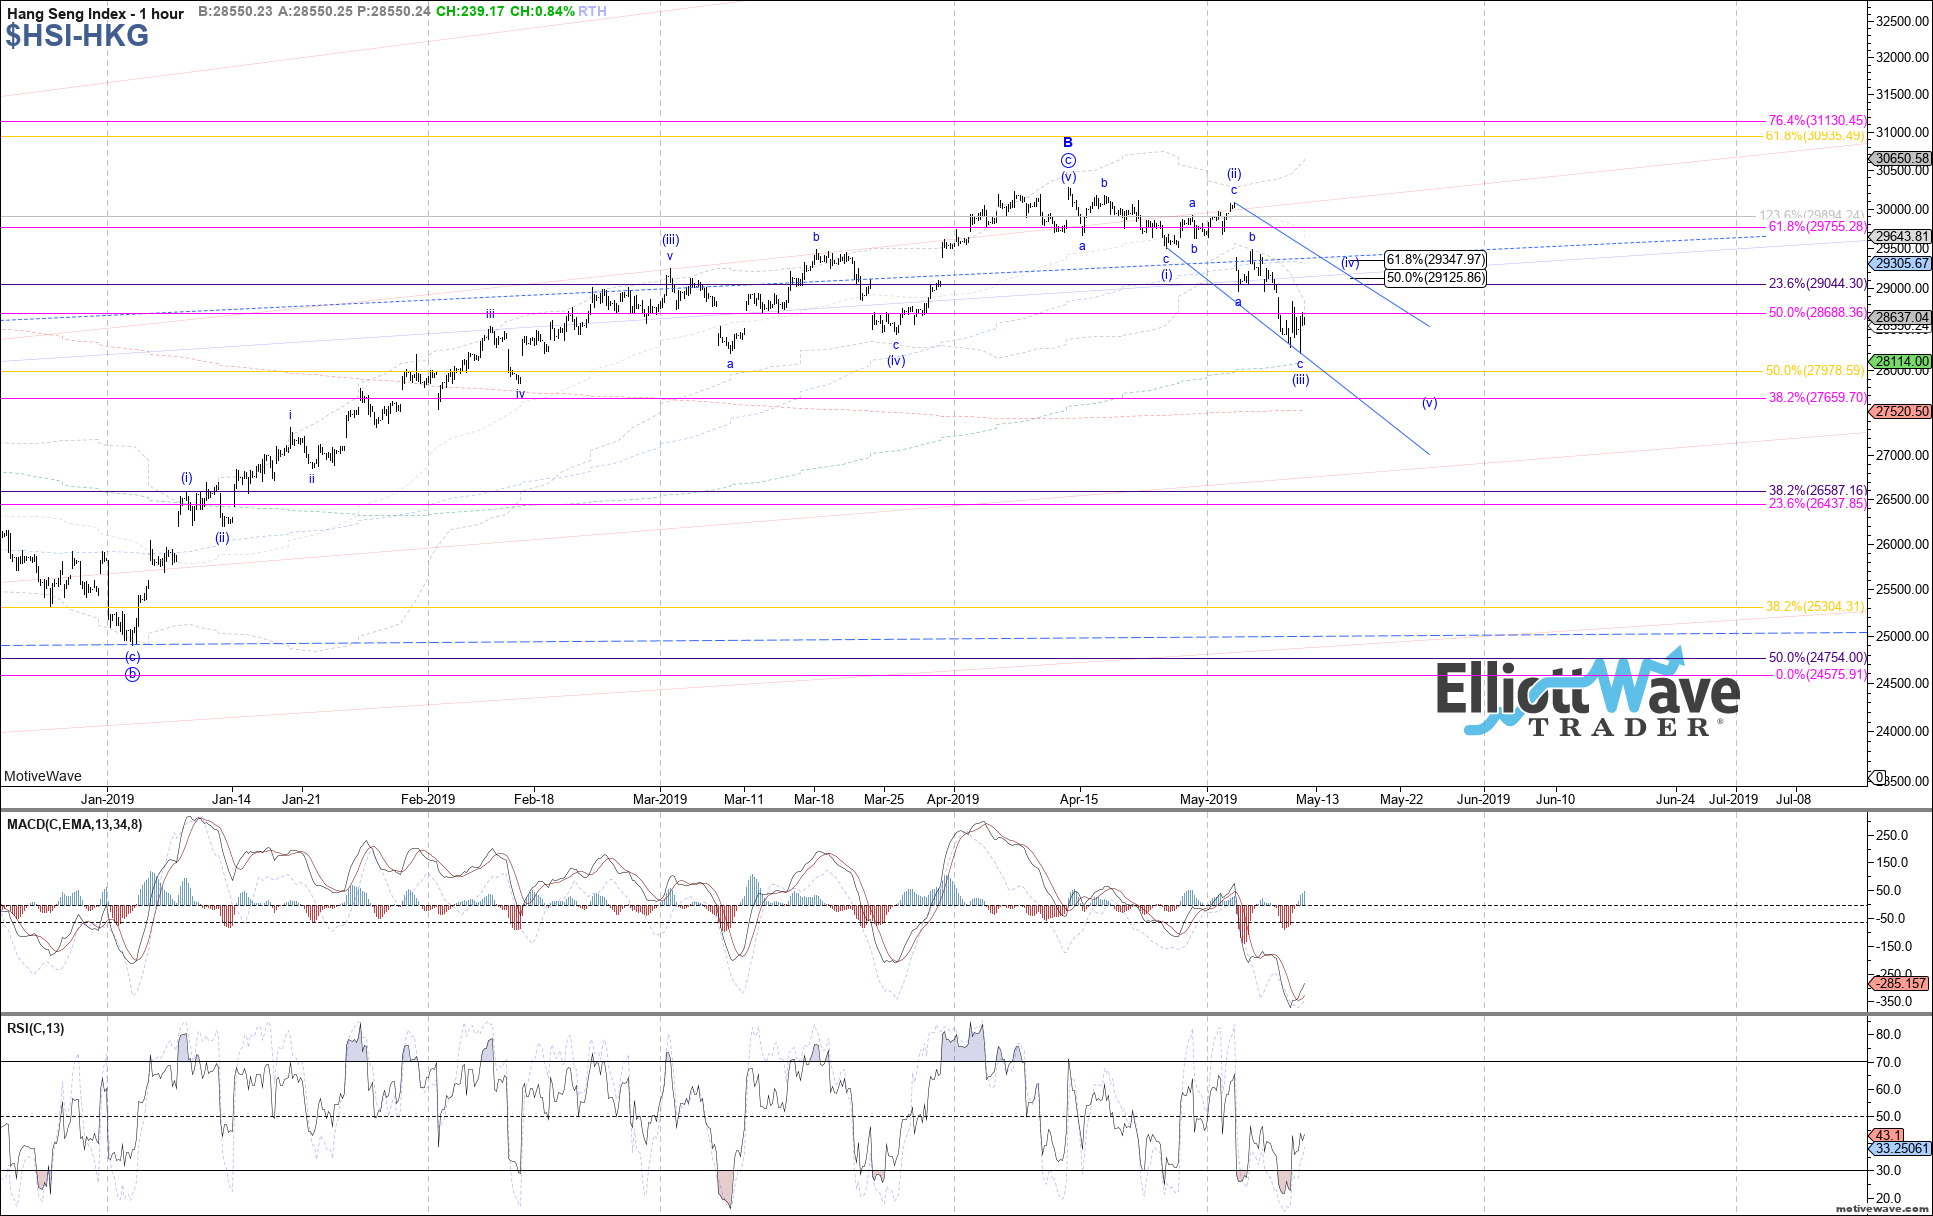
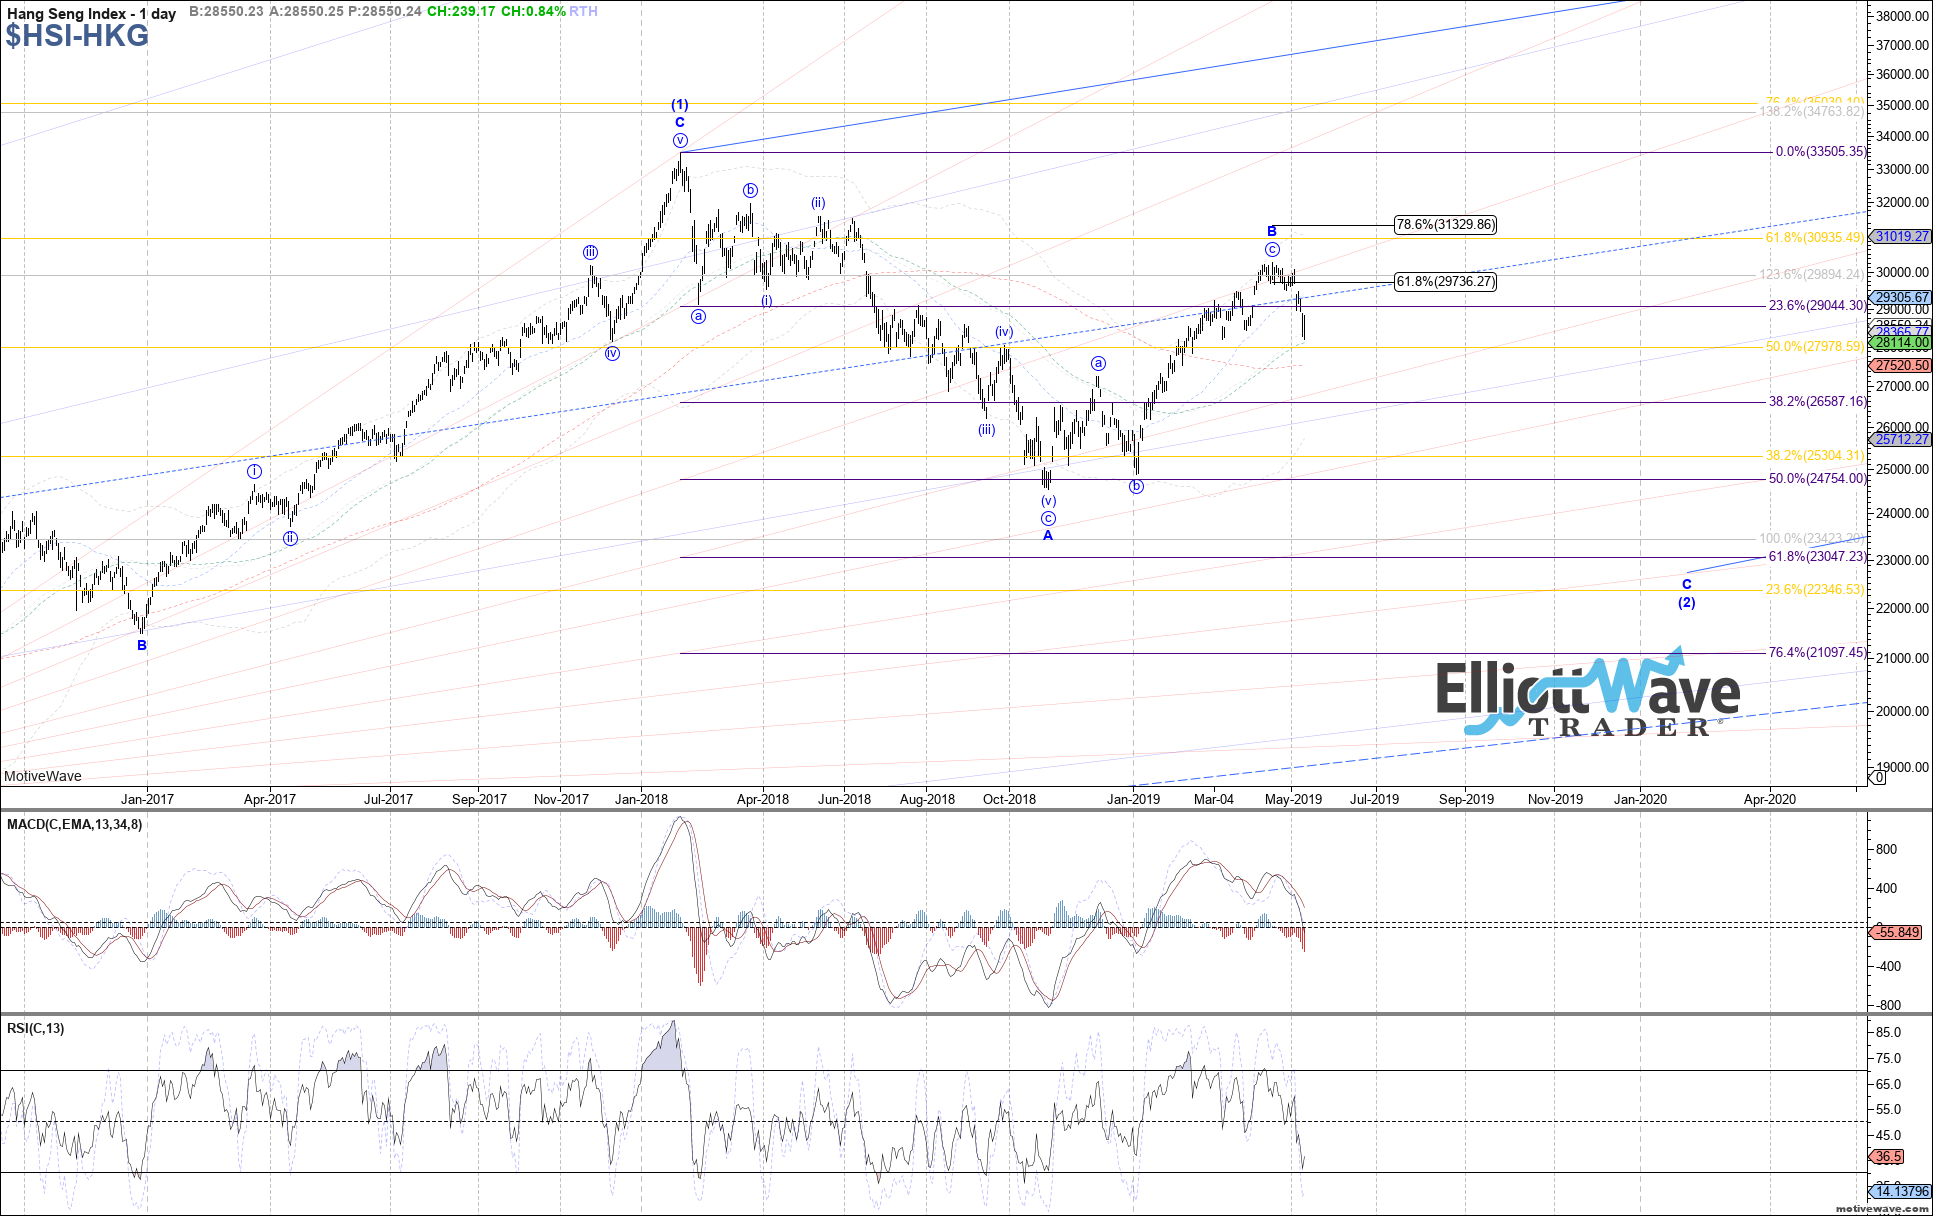
HSI: The Hang Seng traded lower last week as well, breaking below signal support to suggest a top in place at the April high as wave B. Based on the price structure down since that high, a leading diagonal fits best if filling out 5 waves. Under that assumption, the recent low would have completed wave (iii) of the LD, with room for a near-term bounce back to 29125 – 29350 as wave (iv) of the LD before turning back down again in wave (v) to complete the LD.
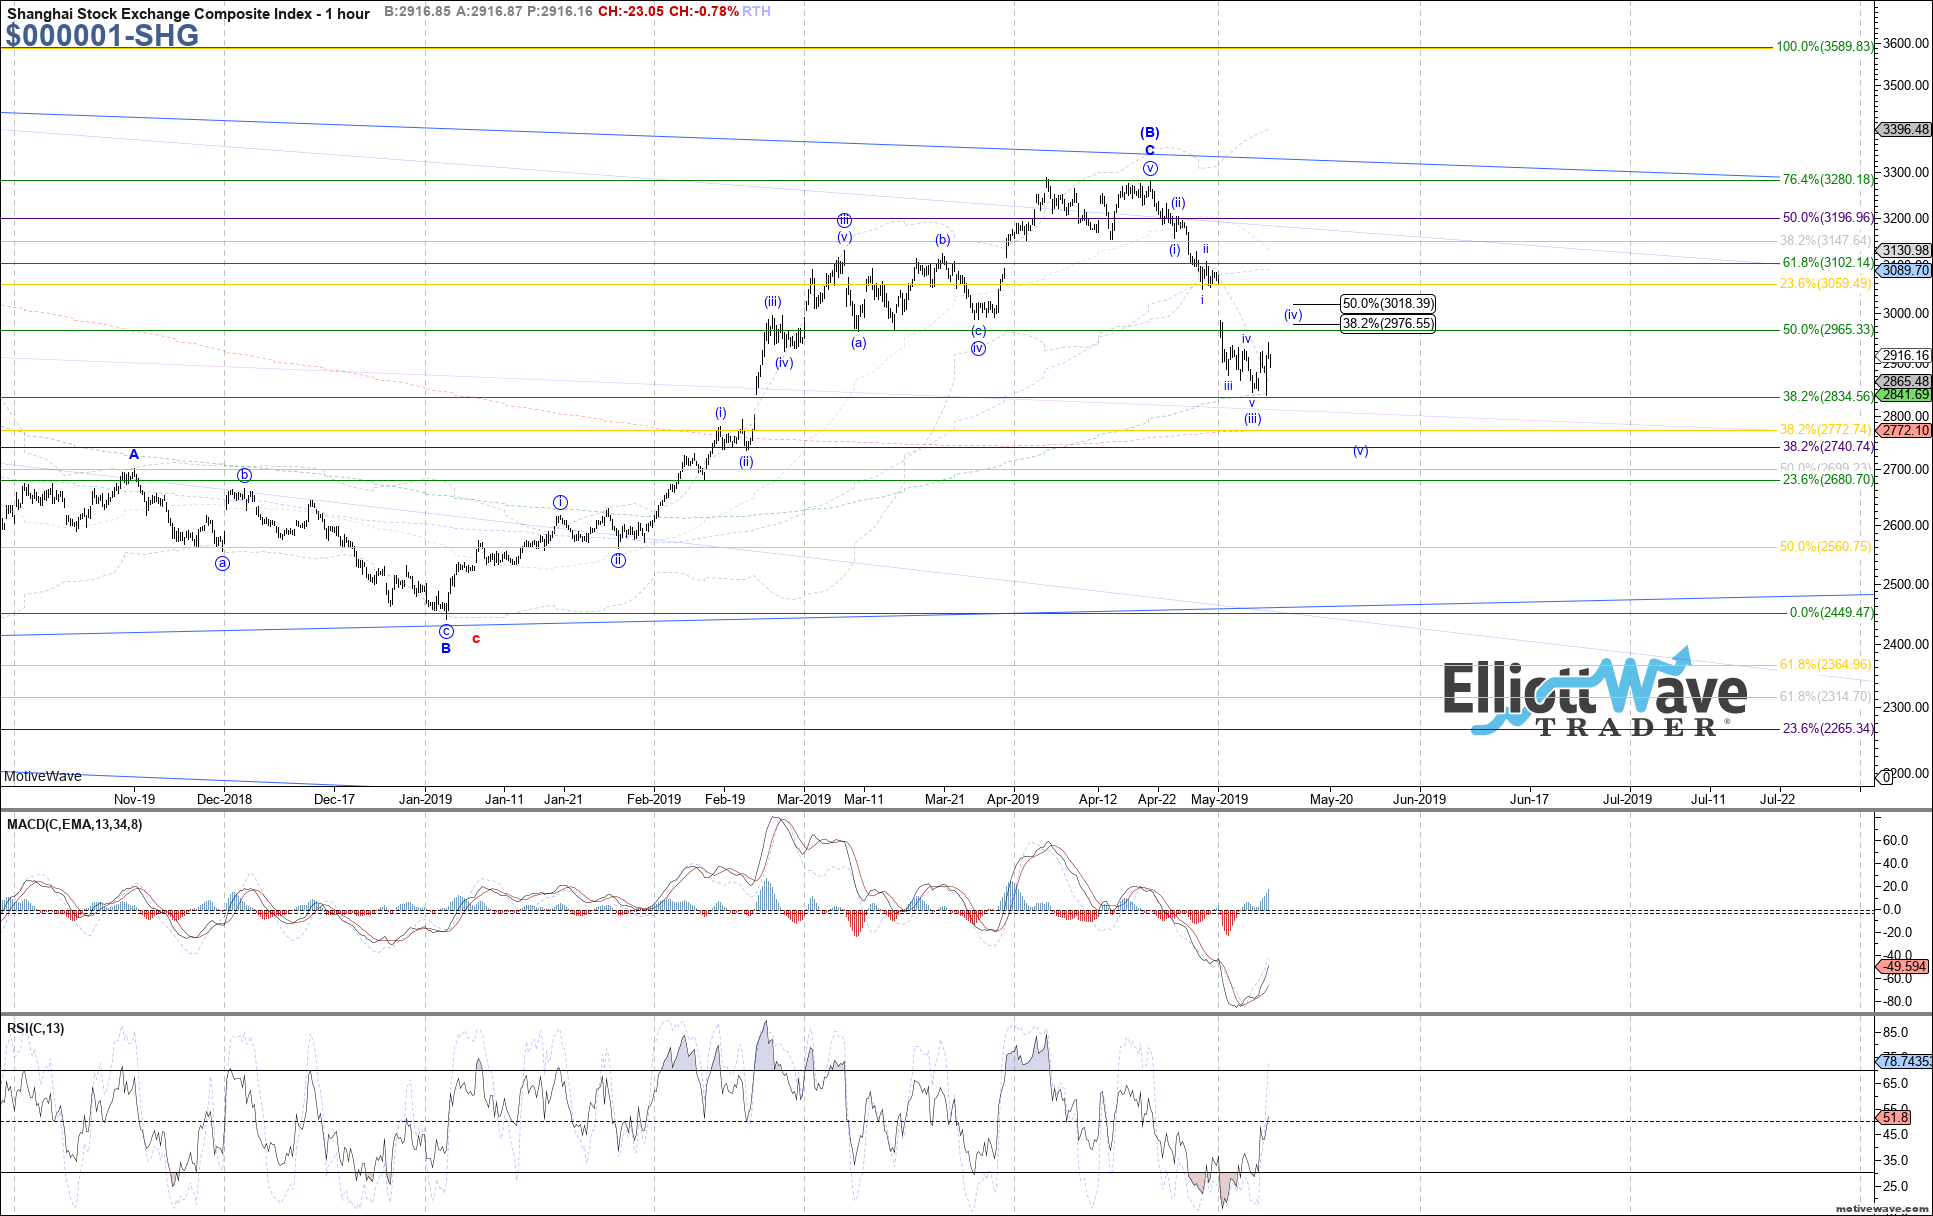
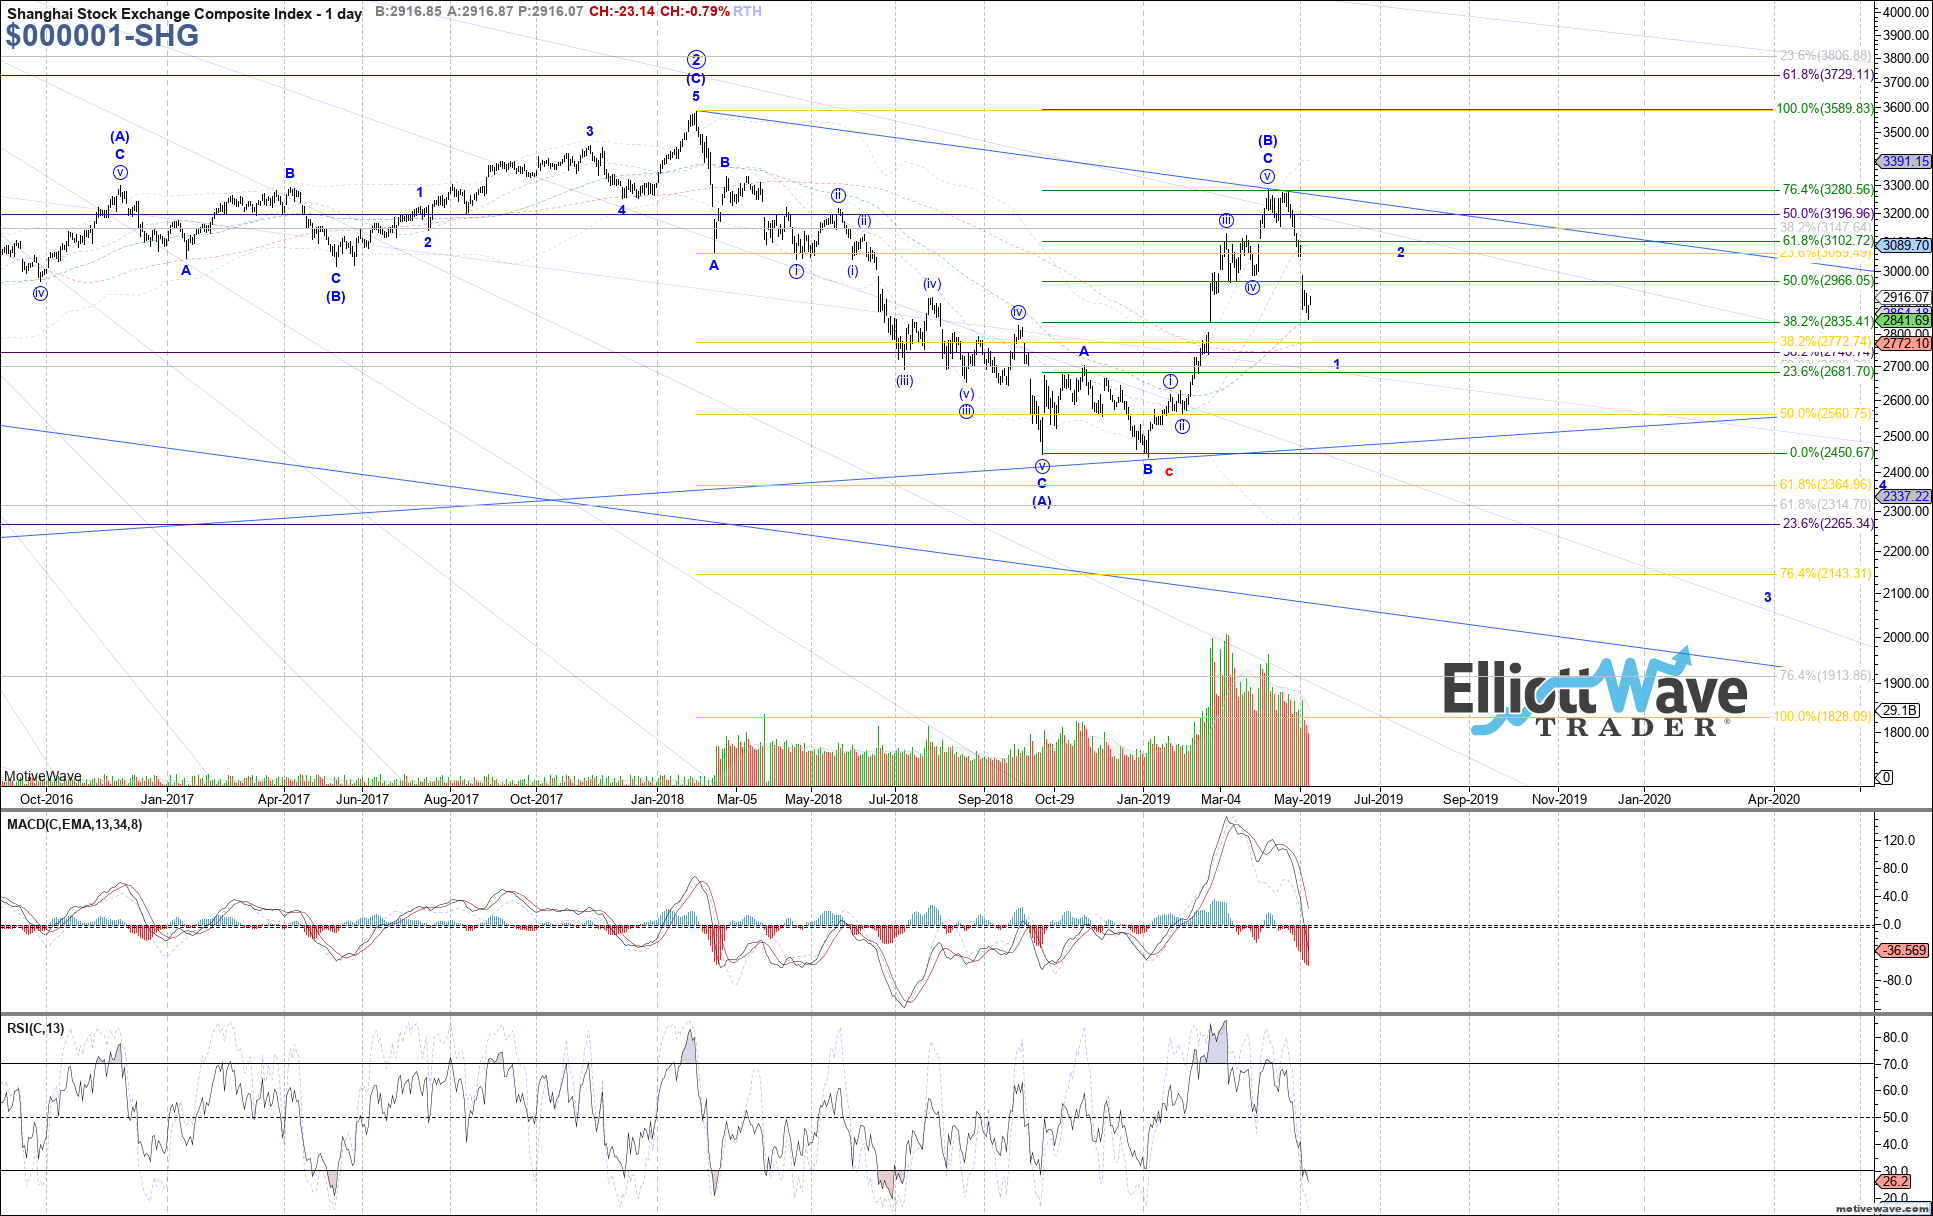
SSEC: The Shanghai Composite also continued strongly lower last week, adding further confirmation to a top in place at the April high as wave (B). The price structure down since last month’s high can easily be considered impulsive, with last week’s low completing wave (iii) of the impulse and price now consolidating in wave (iv). There is room up to 2975 – 3020 near-term in wave (iv) if needed, before turning back down to a new low in wave (v) to complete the impulse.
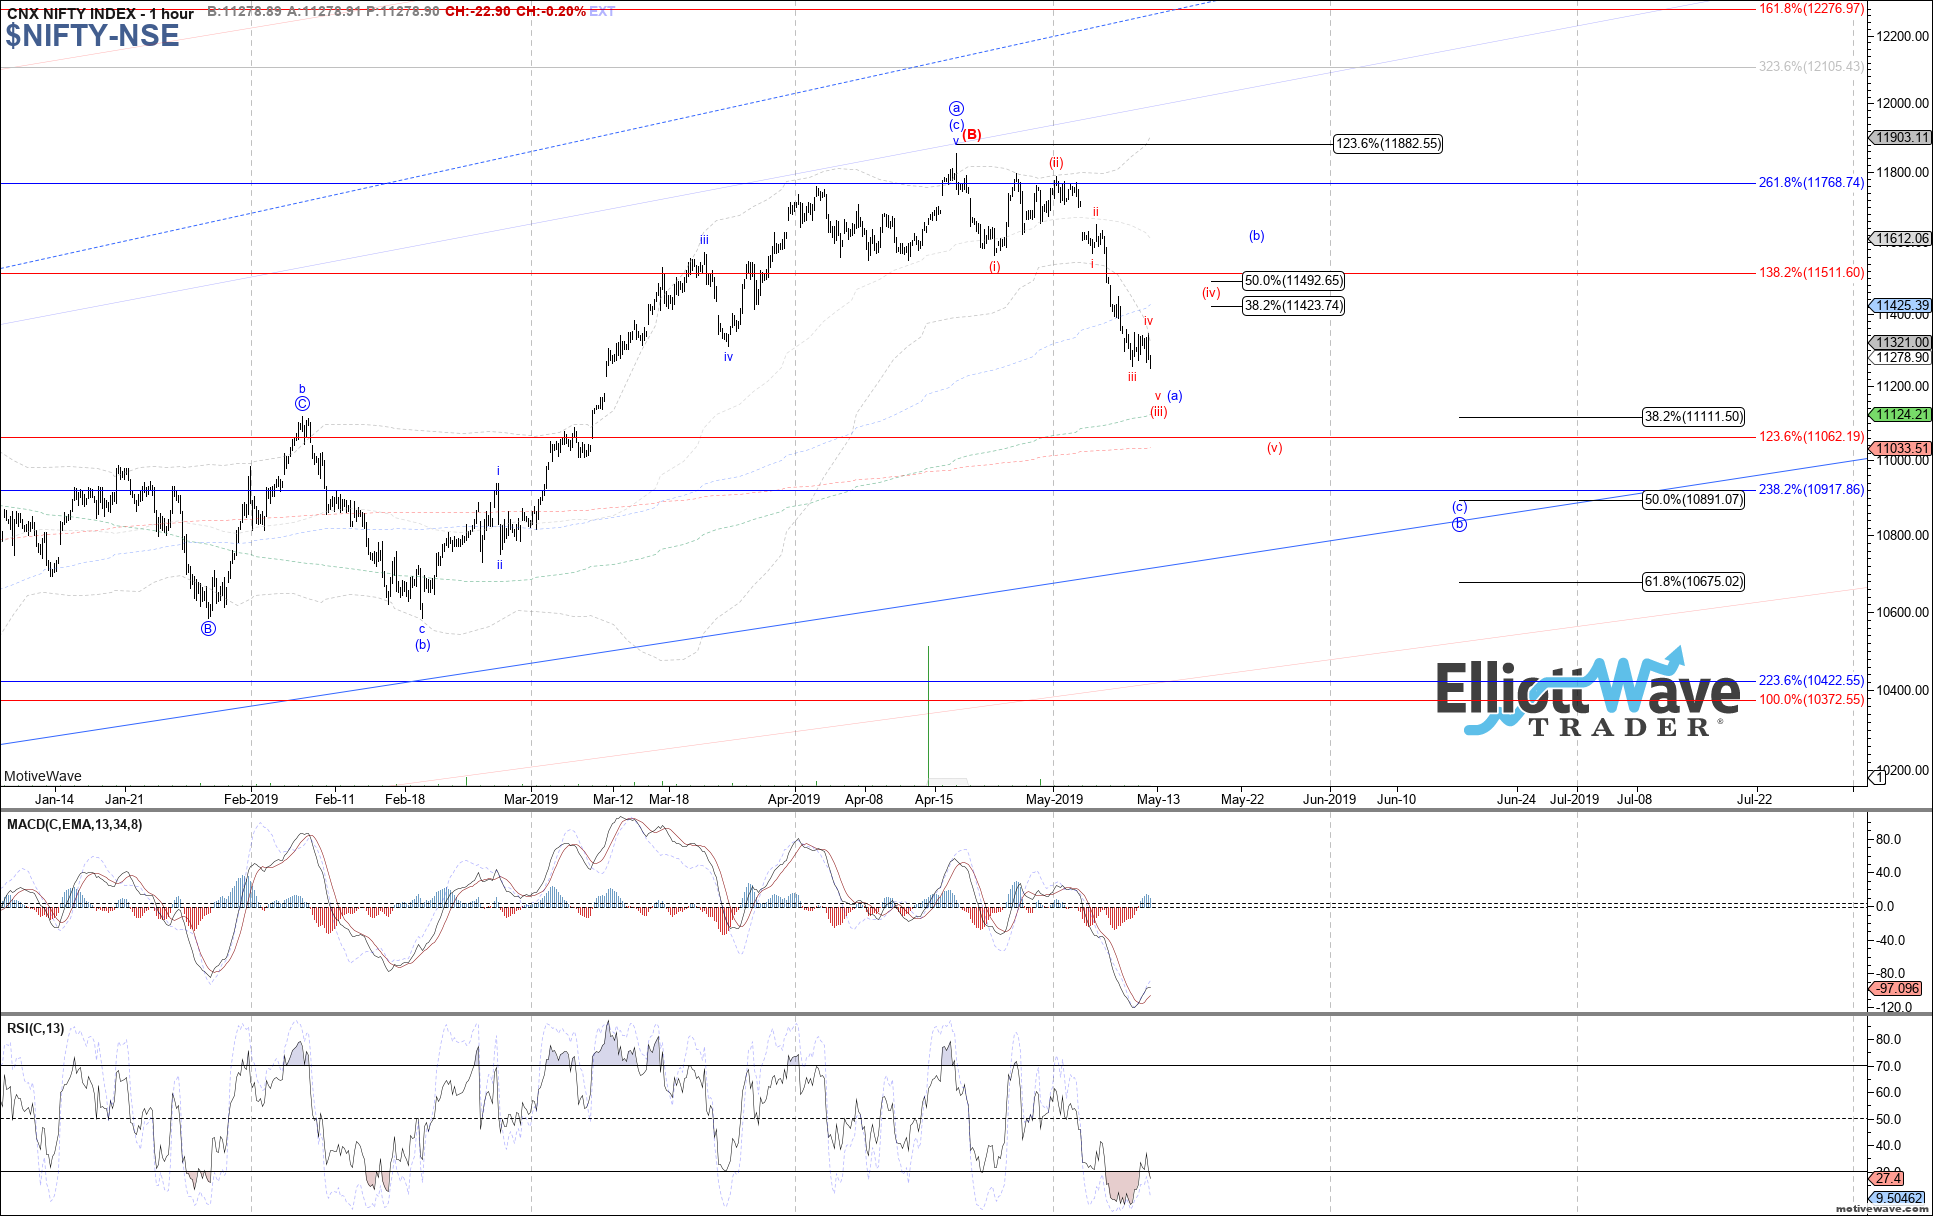
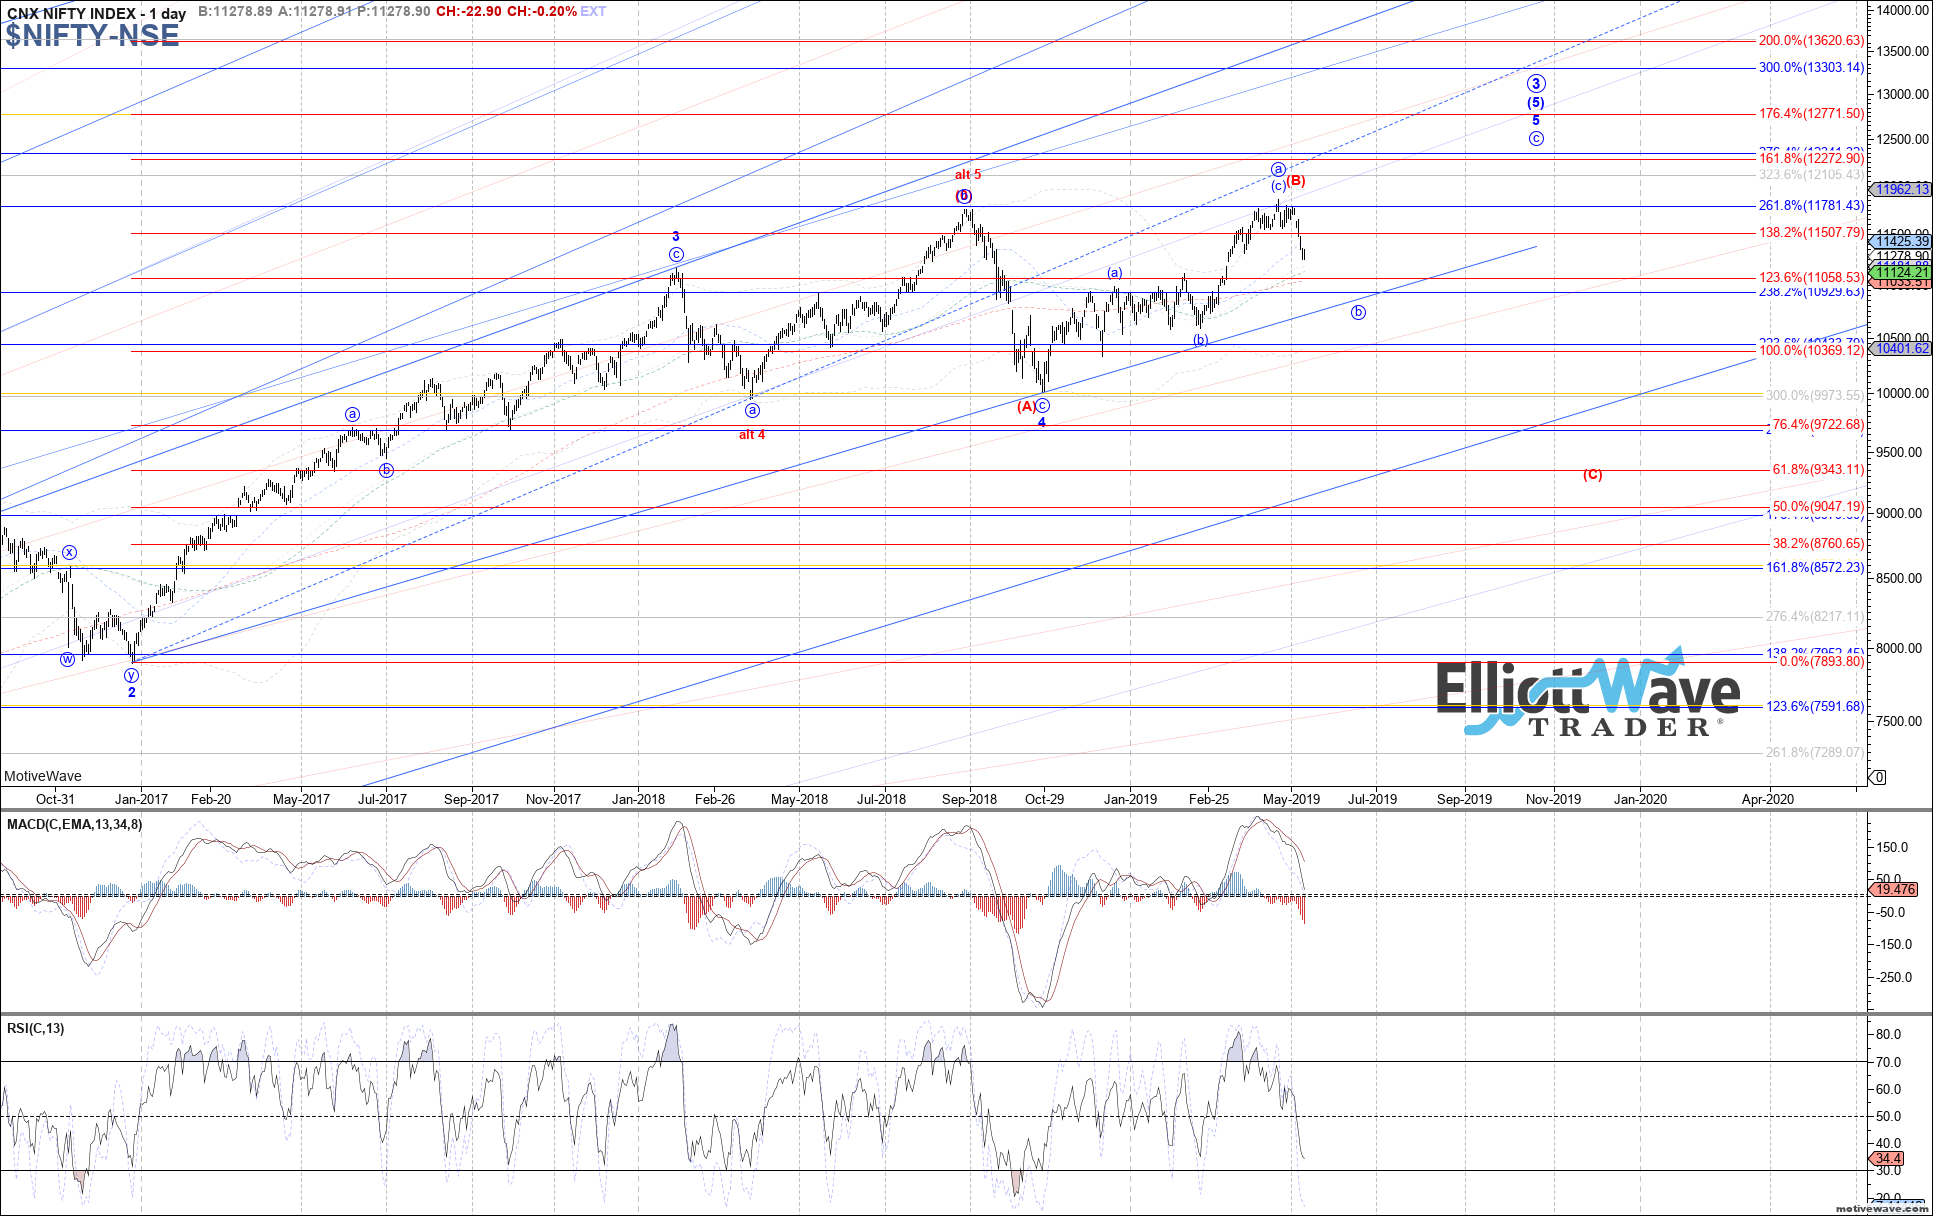
NIFTY: The Nifty dropped sharply last week, breaking below the prior April lows with ease. Therefore a top should be in place at the April high as either blue wave a of 5 or red wave (B). If price continues to fill out 5 waves down of last month’s high, it will support the latter count, likely as wave 1 of (C). In order to consider a clean 5 waves down though, another (iv) and (v) is needed, shown on the chart in red. Otherwise, a 3 wave decline off the April high can be considered wave (a) of b in blue, with the next bounce being wave (b) of b.
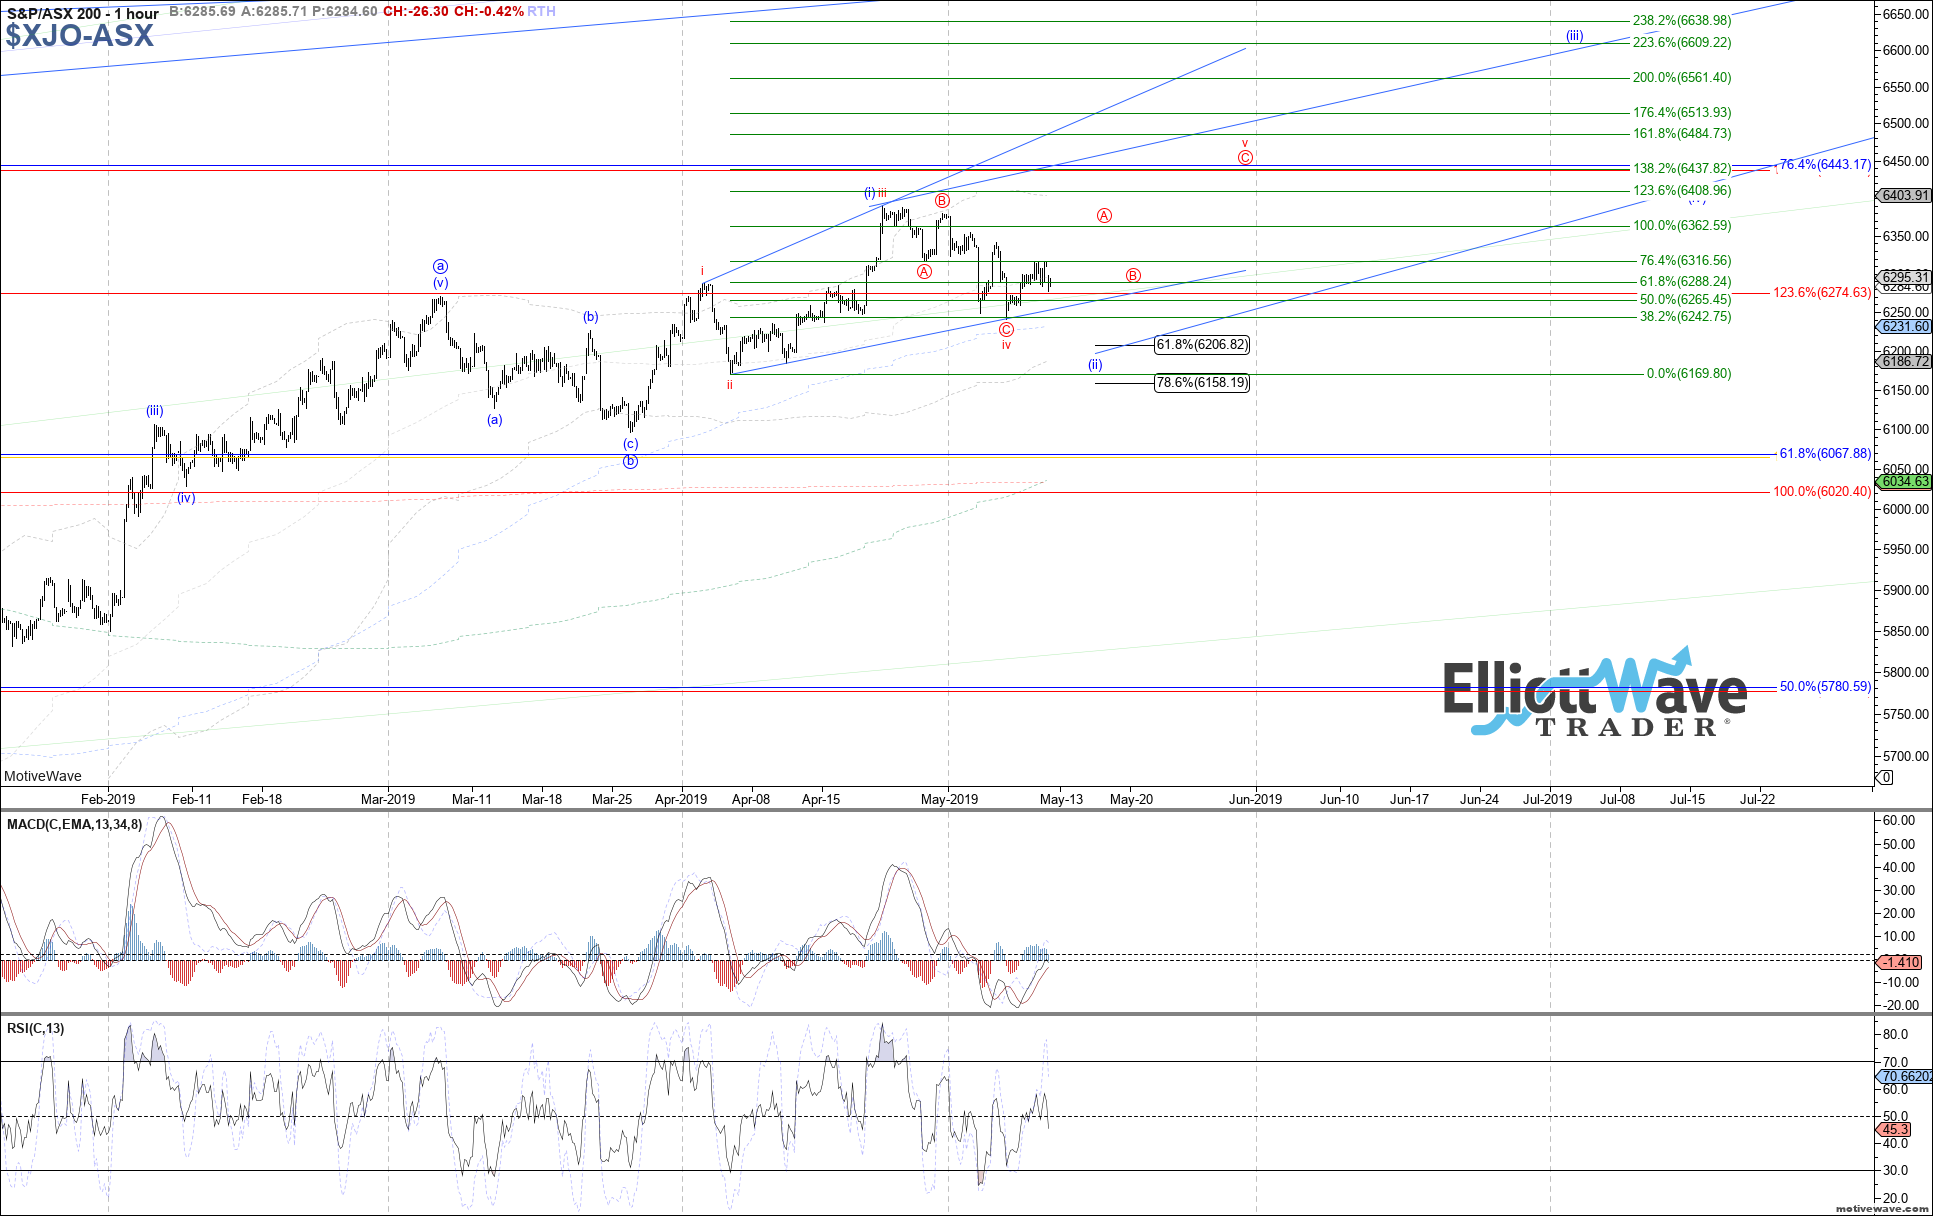
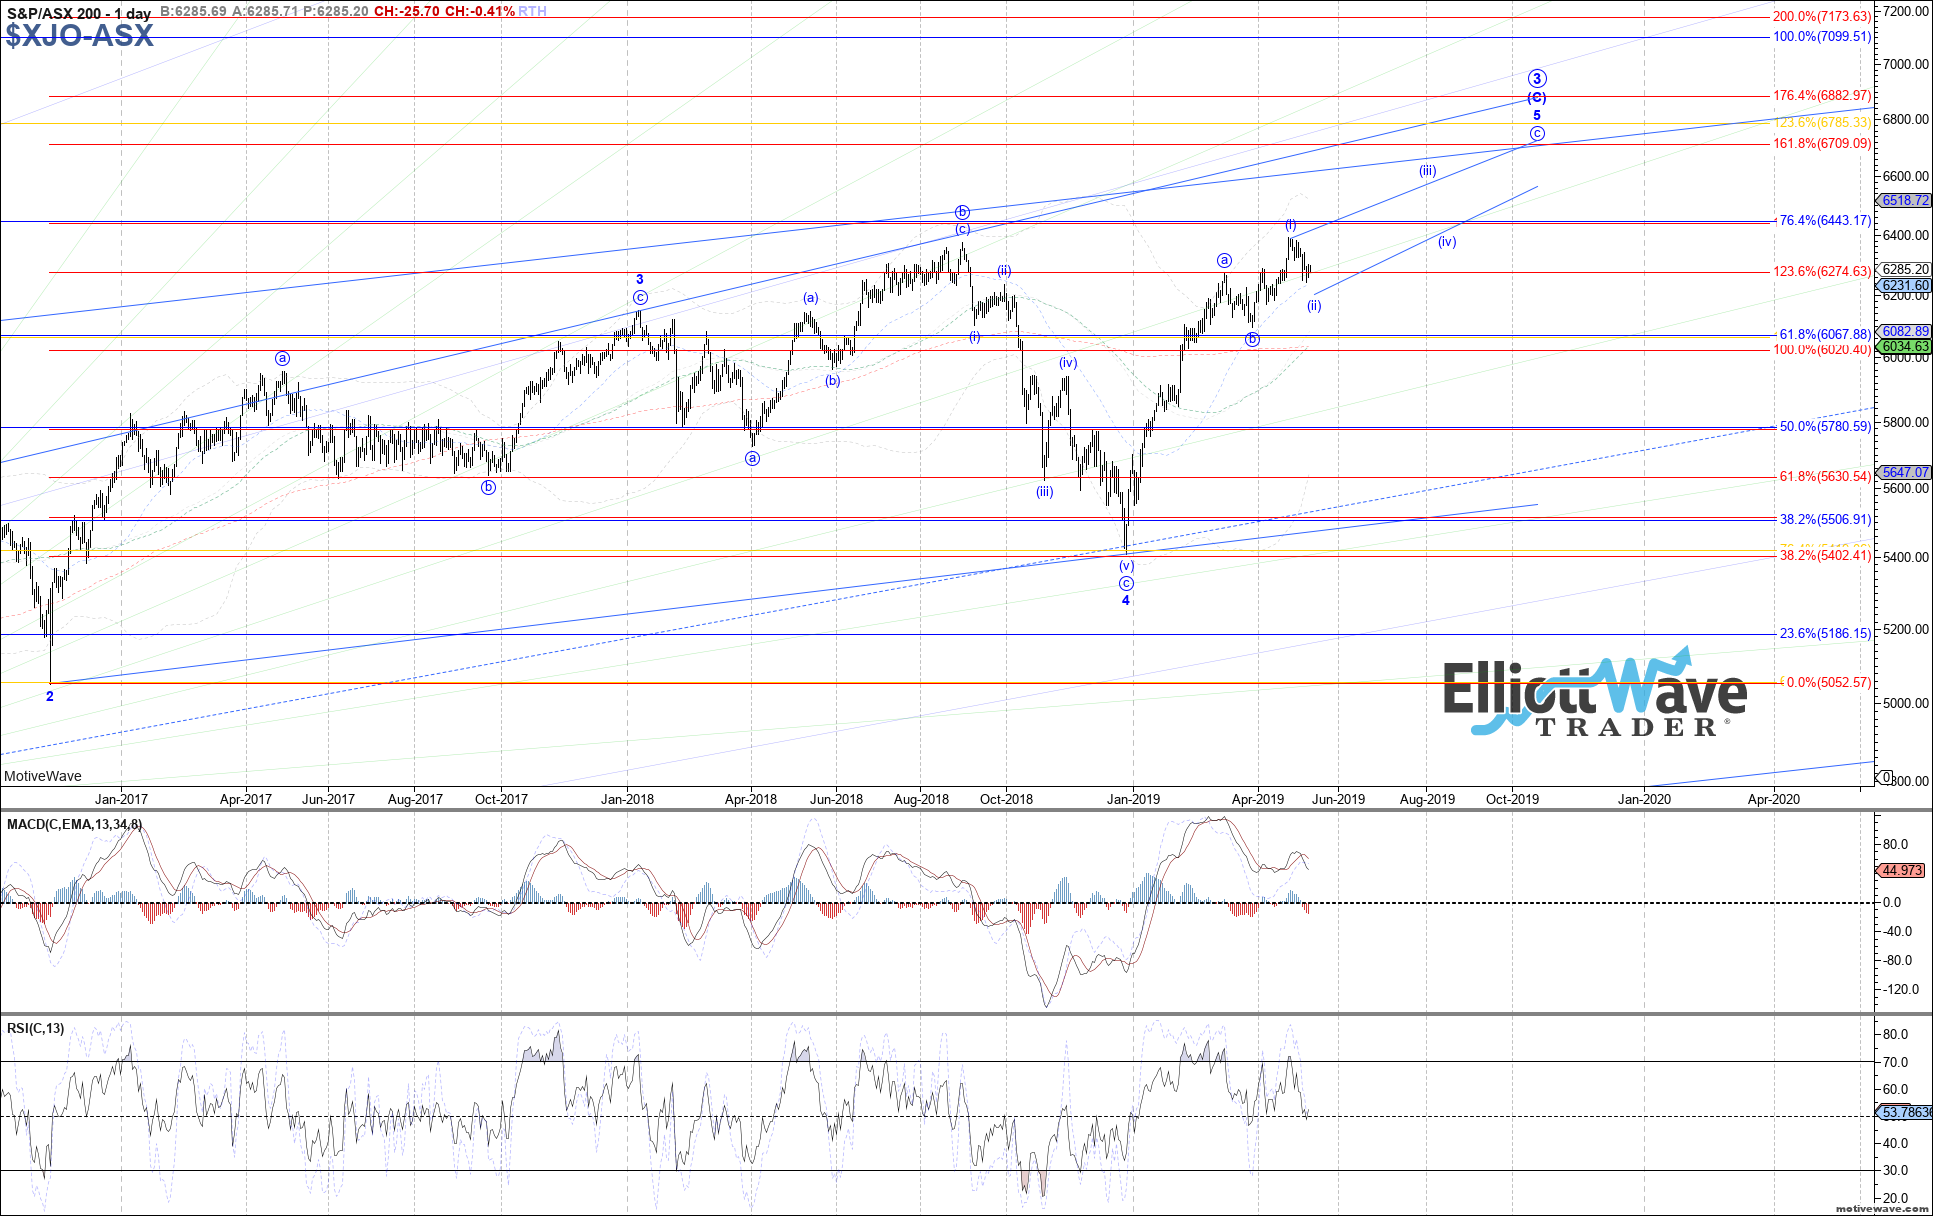
XJO: The ASX traded lower last week, but held up better overall compared to other markets. Therefore, there are still bullish options to consider, with the most immediately bullish count shown in red. As long as last week’s low holds, then price can continue up toward ~6435 from here as red wave v to complete a more muted diagonal off the March low. Otherwise, below last week’s low opens the door to lower support between 6205 – 6160 for blue wave (ii) of a larger possible diagonal off the March low.