The Smart Money - Member Guide
 By
By
The Smart Money - Member Guide
Overview
The Smart Money provides daily reports analyzing the Emini S&P 500 (ES), Bonds, and GDX. The analysis is based on proprietary indicators, known collectively as the Razzmatazz Indicators, developed by former analyst and current member Bill Albert ("El_Hombre"/"EHE"). These track options trading activity, and rise (and turn bullish on the market) when options traders (following the "herd") put their money into bearish bets, and vice versa.
The service also provides directional alerts on the ES and trade signals in the QLD/QID and SSO/SDS based on indicators, including my NYHL, which measures NYSE highs and lows, and Bill's "Secret Indicator Combo."
Razzmatazz Indicators
Tracking the Razzmatazz Indicators is a major portion of what we do in this room and the basis of our daily reports. The indicators are based on open interest on the ES futures and other instruments depending on what we are analyzing. Most put/call ratios and analysis is based on volume and not Open Interest. OI is the fuel which drives trends in the market. Even though we say "da boys mission control" and so on, there is no "THEY." It is just the actions of smart money and the bigger institutions that show up in the market moving positions and big money and so affecting the open interest. This is the basis of all technical analysis and it is very evident in Open Interest based analysis.
The premise is that smart money sells premium on options while dumb money buys them. This does not always have to be the case but is true more than often. There is a reason most options expire worthless. So when open interest in ES puts increases relative to the calls, it means that the smart money is bullish on the market while the dumb money is not. So they are using the option selling machine to sell puts to the public and pocket the premium. So the Put/Call Ratio (PCR) rises, hence implying a rising market. The reverse happens when "THEY" are bearish on the markets. This is a dynamic indicator that will change with time, and depending on conditions smart money can change their bias. If they do, then it will show up in the Razzmatazz.
Short-Term Razzmatazz is the weekly value of the Put/Call Ratio, plotted daily (gray line below). A more recent addition is the Daily Razzmatazz (red line below) which is basically the day-to-day values of the PCR, necessitated due to Monday, Tuesday and Friday options being added to the mix.
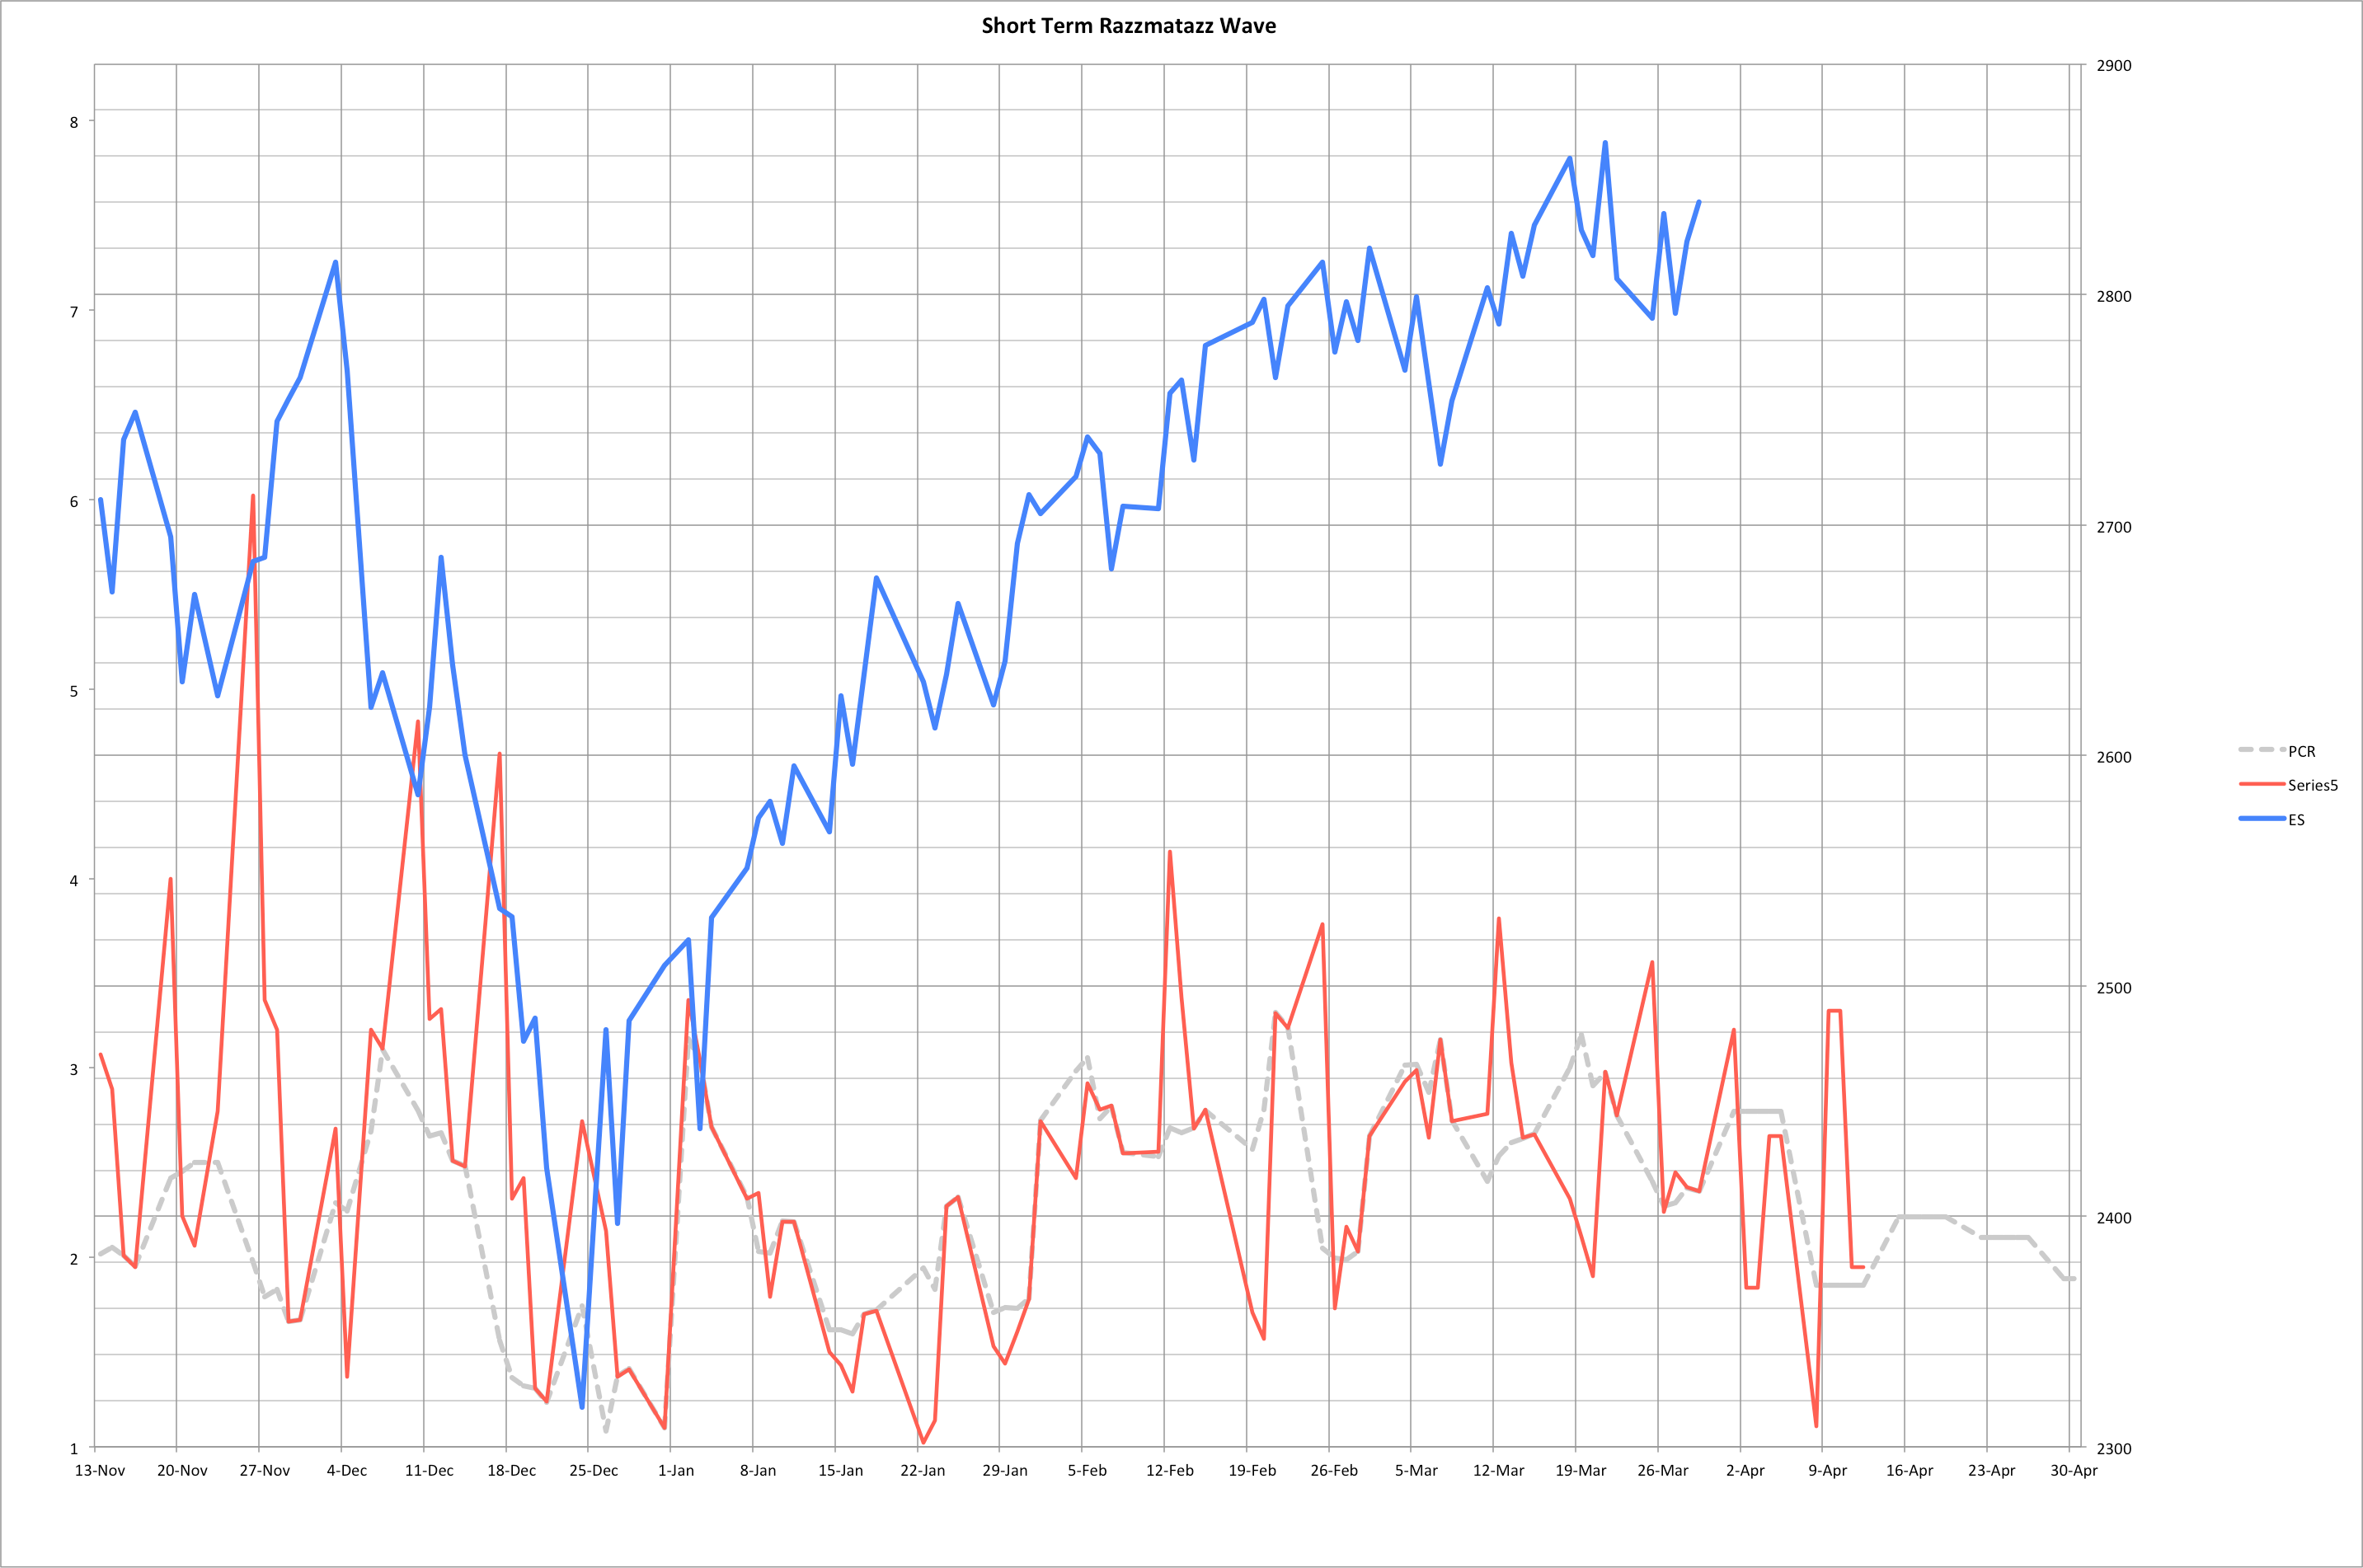
A shift in OI generally shows which way the smart money is shifting their bias to. The shape of the Daily Razzmatazz is very good in determining which way the market is biased. Again this is not an exact science but an art, and how you read the chart is important. Using EW patterns and other analysis in conjunction with this helps. Combining EW with this can help with zeroing in on a higher probability count vs. the alternate.
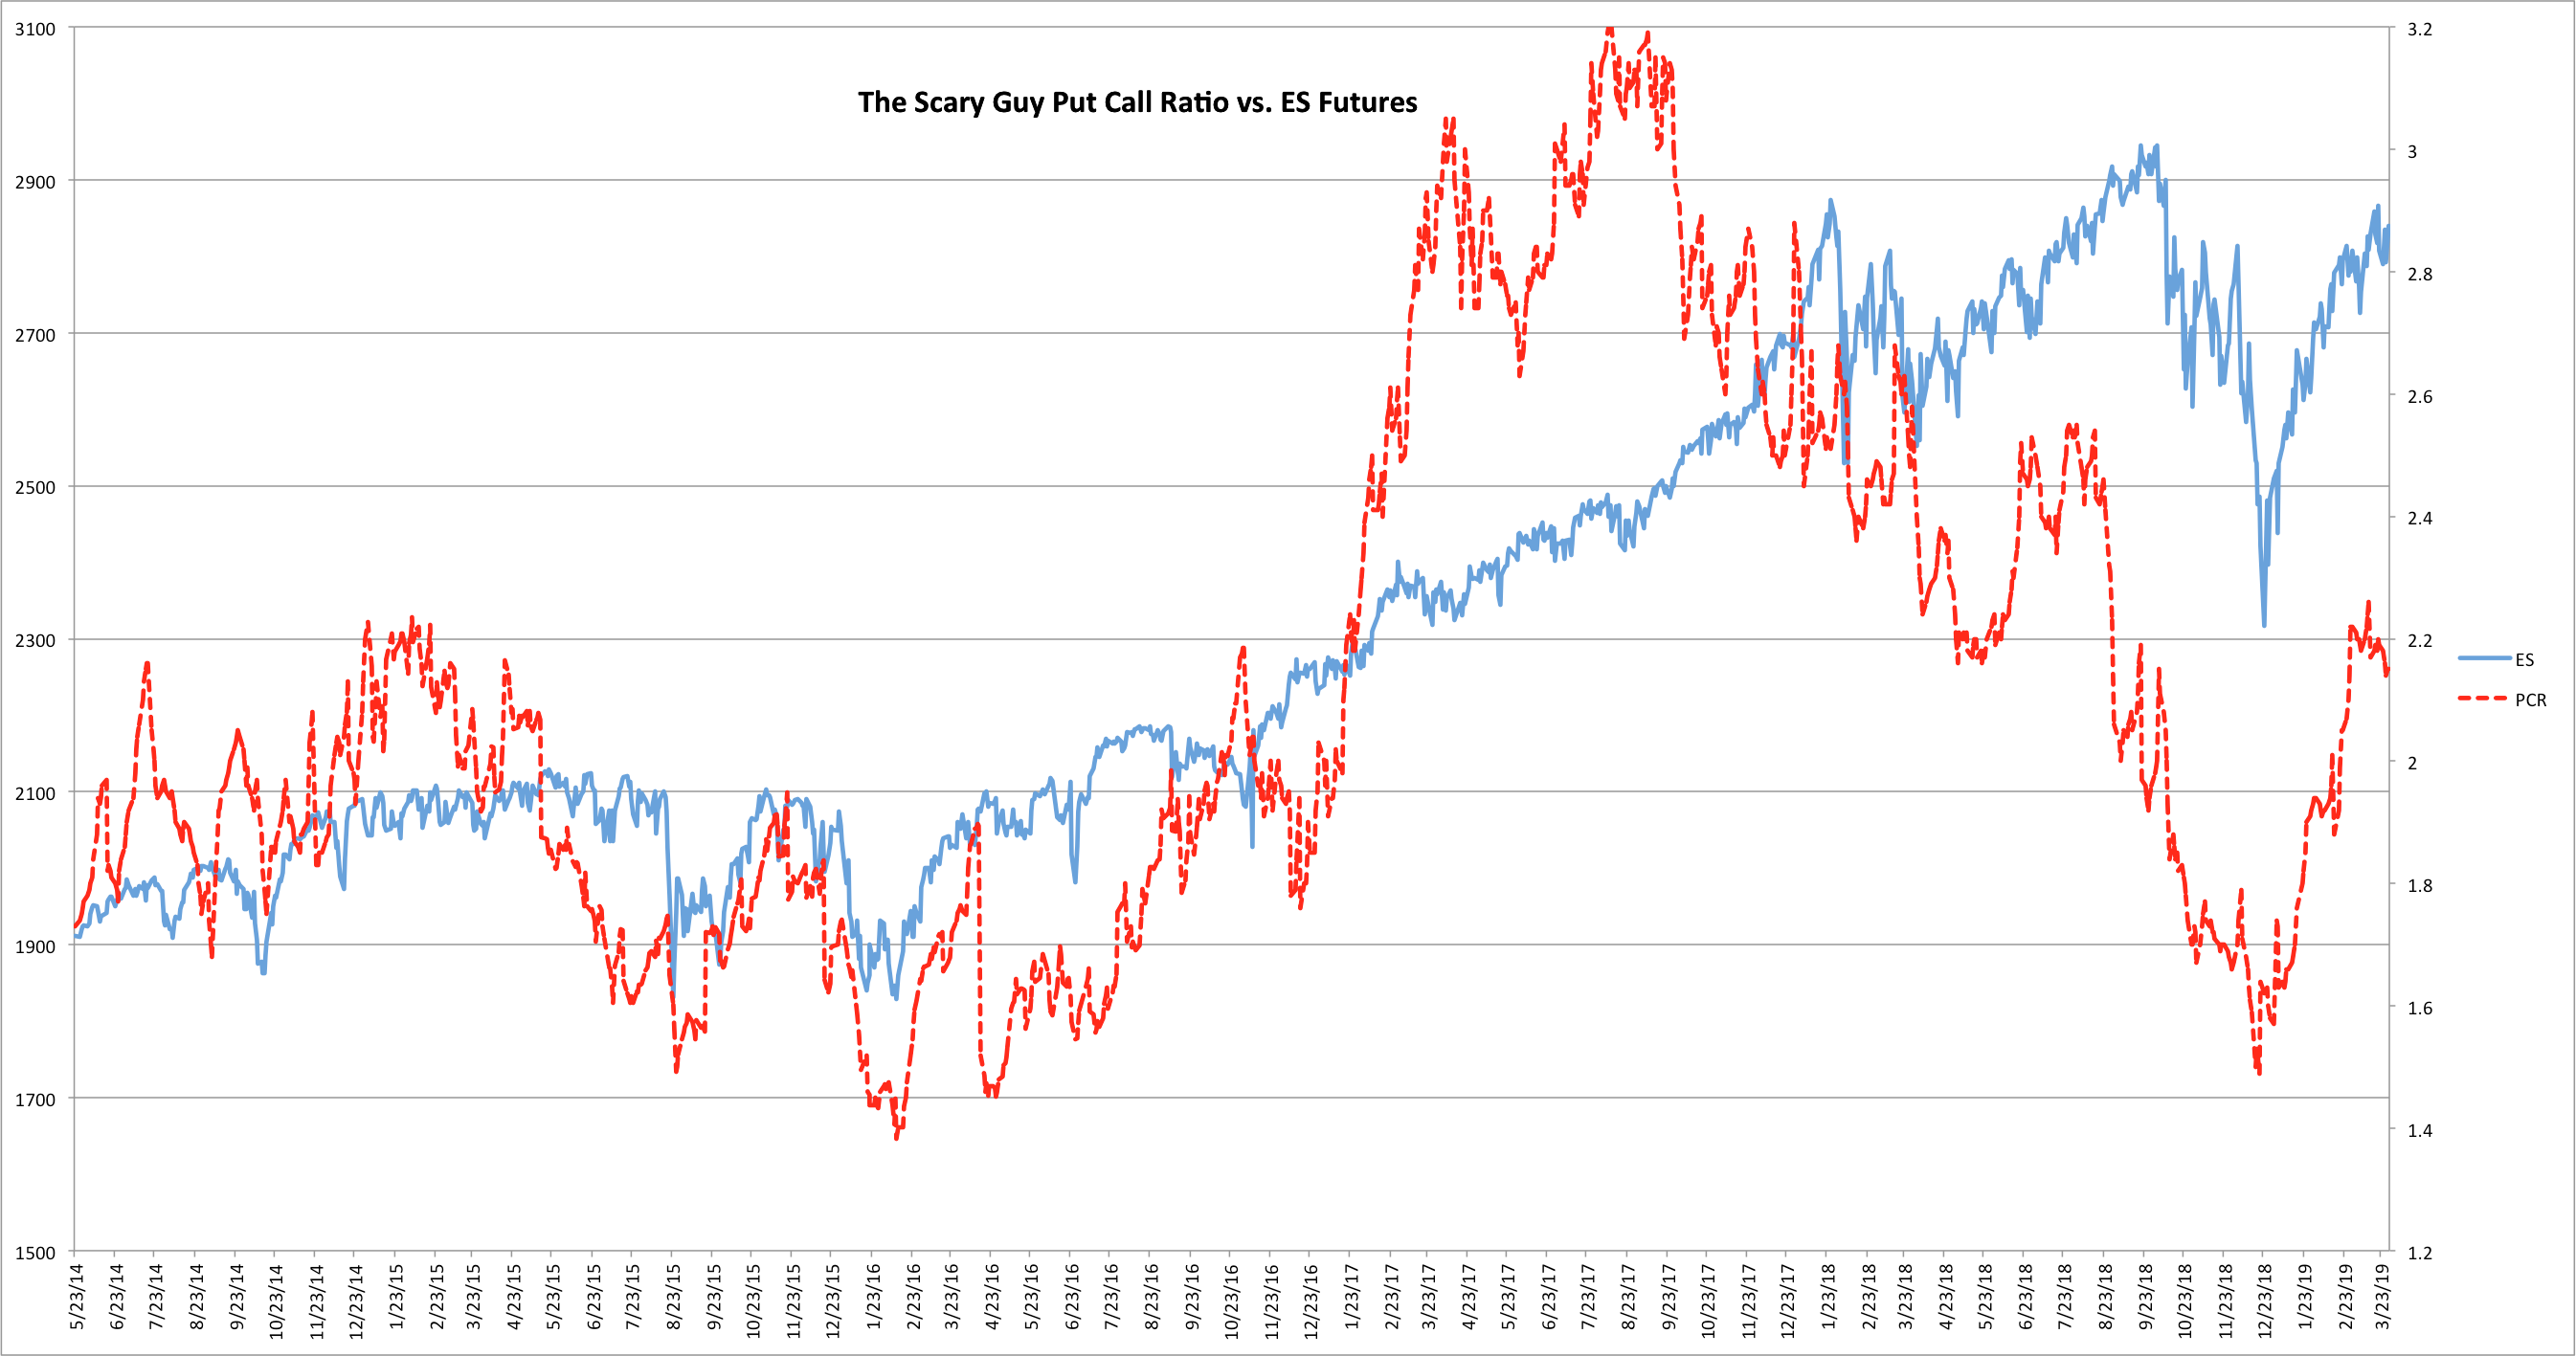
SGPCR: Scary Guy Put Call Ratio, named after Bill, our resident "Scary Guy," is the overall put by call ratio of open interest on the ES. The movement of the SGPCR can be used to spot trends in the market.
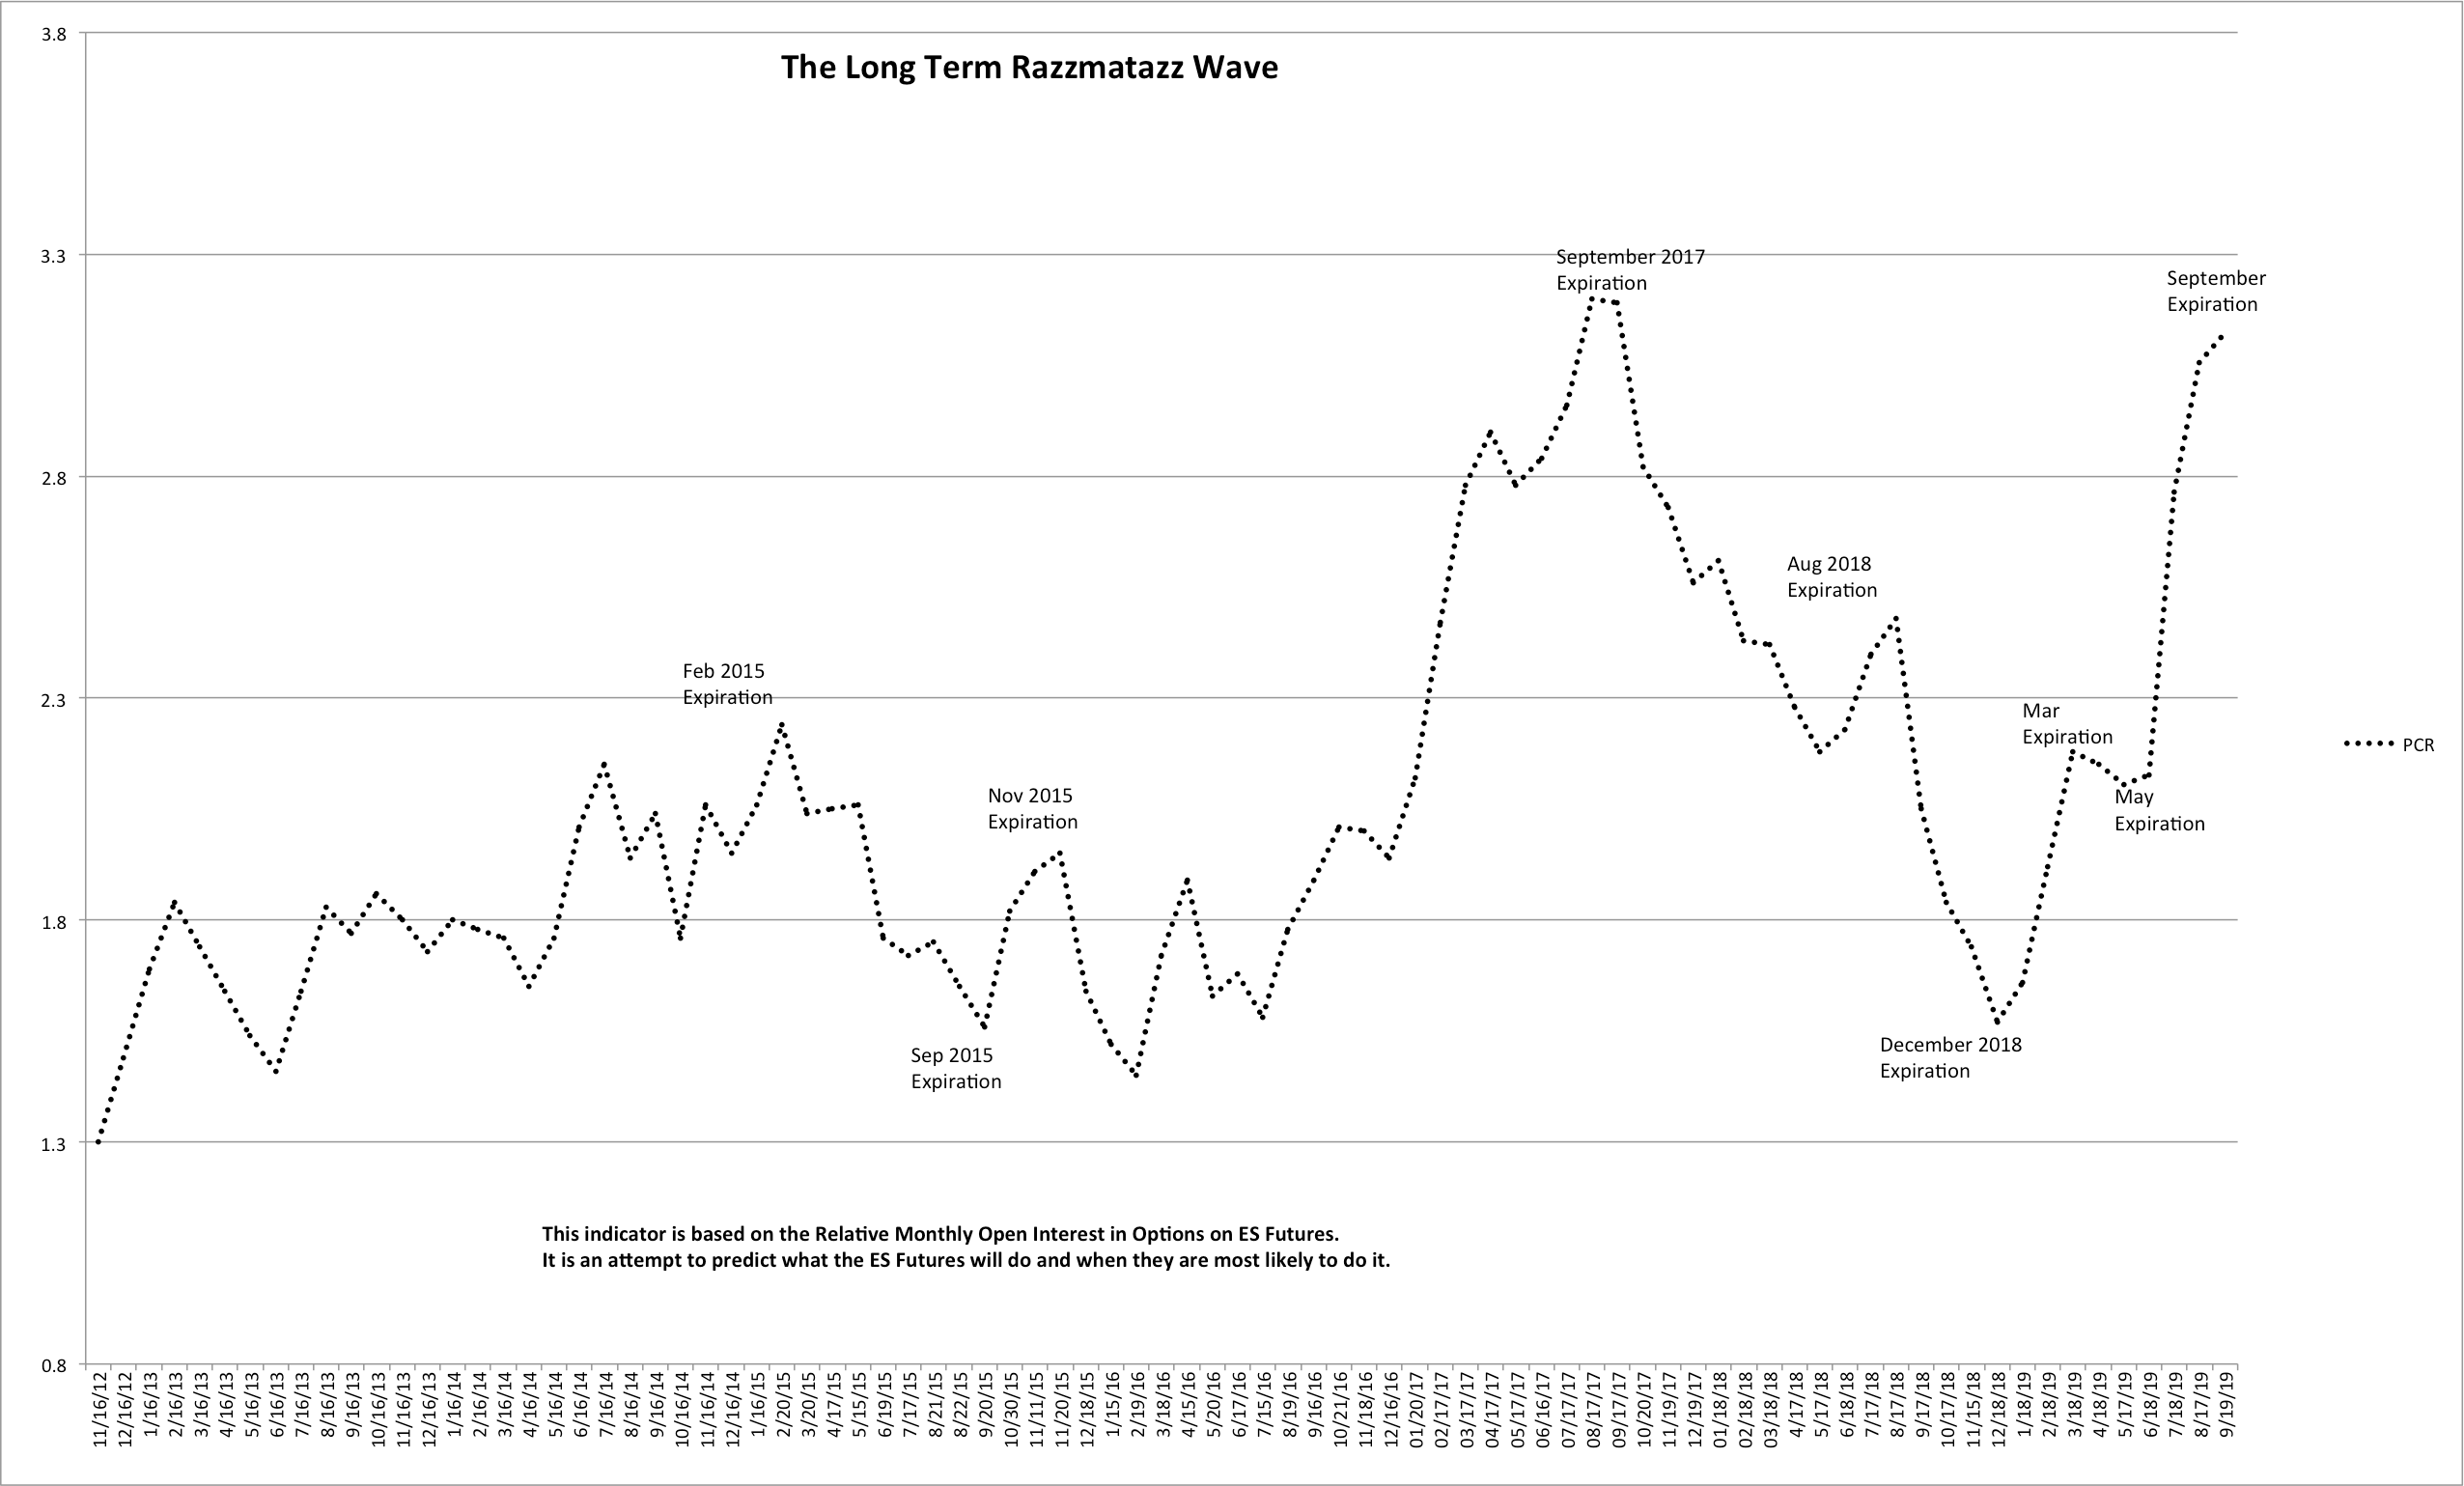
Long Term Razzmatazz Wave: This model is developed using the open interest data to project what the Scary Guy Put Call Ratio might be at each monthly expiration in the future. Since price will track the SGPCR most of the time, having this projection with the Long Term Razzmatazz wave can help us determine the direction of price in the future from monthly expiration to expiration. Remember, though, that since this uses several months out OI in the calculation, it will be prone to changes over time.
Option Expiries: We have Monday, Wednesday and Friday (weekly) options active on ES every week. In addition to this we have end of month or EOM options. Then we have monthly expiries, which are the monthly OPEX’s that I refer to in some posts. The monthly OPEX’s are the big ones and fall on the 3rd Friday of every month.
Other Key Indicators
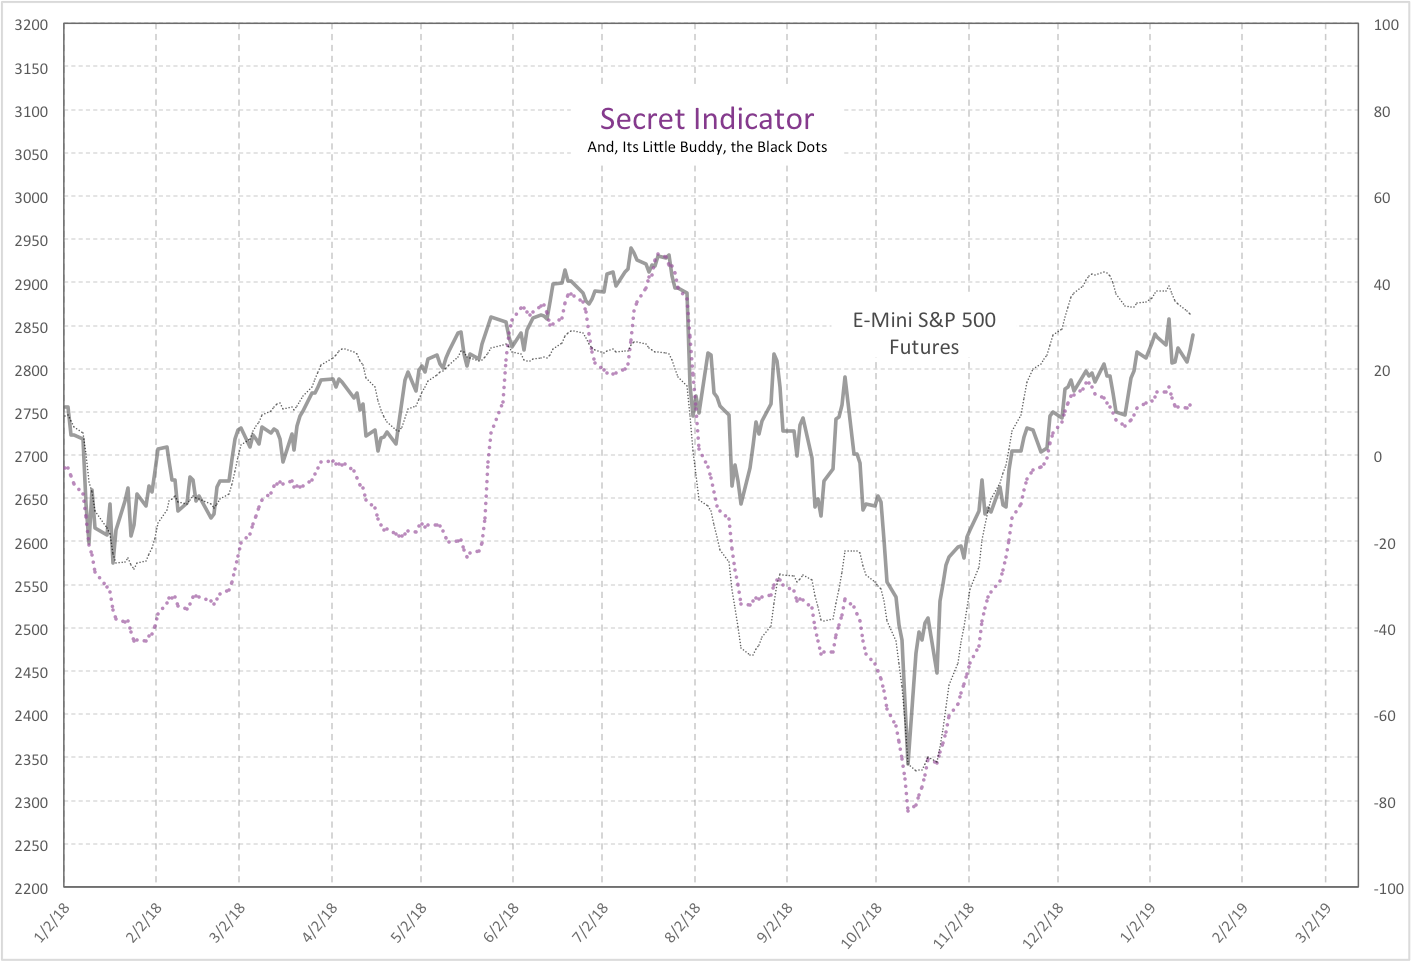
Secret Indicator Combo: The Secret Indicator Combo provides a signal when the red and black dotted lines are in sync either up or down. It's an excellent tool for longer timeframe players. If both are ticking higher, then trend is up and longer term players can hold longs. If both are ticking lower, then the converse is true. When they are pointing in opposite directions, this means trend is sideways or 'turning'/in transition. The arithmetic behind these indicators are ‘secret’ and will remain so as per the wishes of their creator EHE.
NYHL1M and NYHL positional system: NYSE Index High-Low Indicator 1M and the original versions are positional systems I developed to form a more mechanical method of trading in the market. NYHL1M plots on a daily basis the number of issues making new highs minus those making new lows (new highs and lows going back 1 month). A buy signal is issued when this cumulative line (marked in gold on the charts) crosses above the red 39 EMA and blue 19 EMA lines. A sell signal occurs when the gold line crosses back below the red and blue. The NYHL does the same but based on new highs and lows going back 1 year.
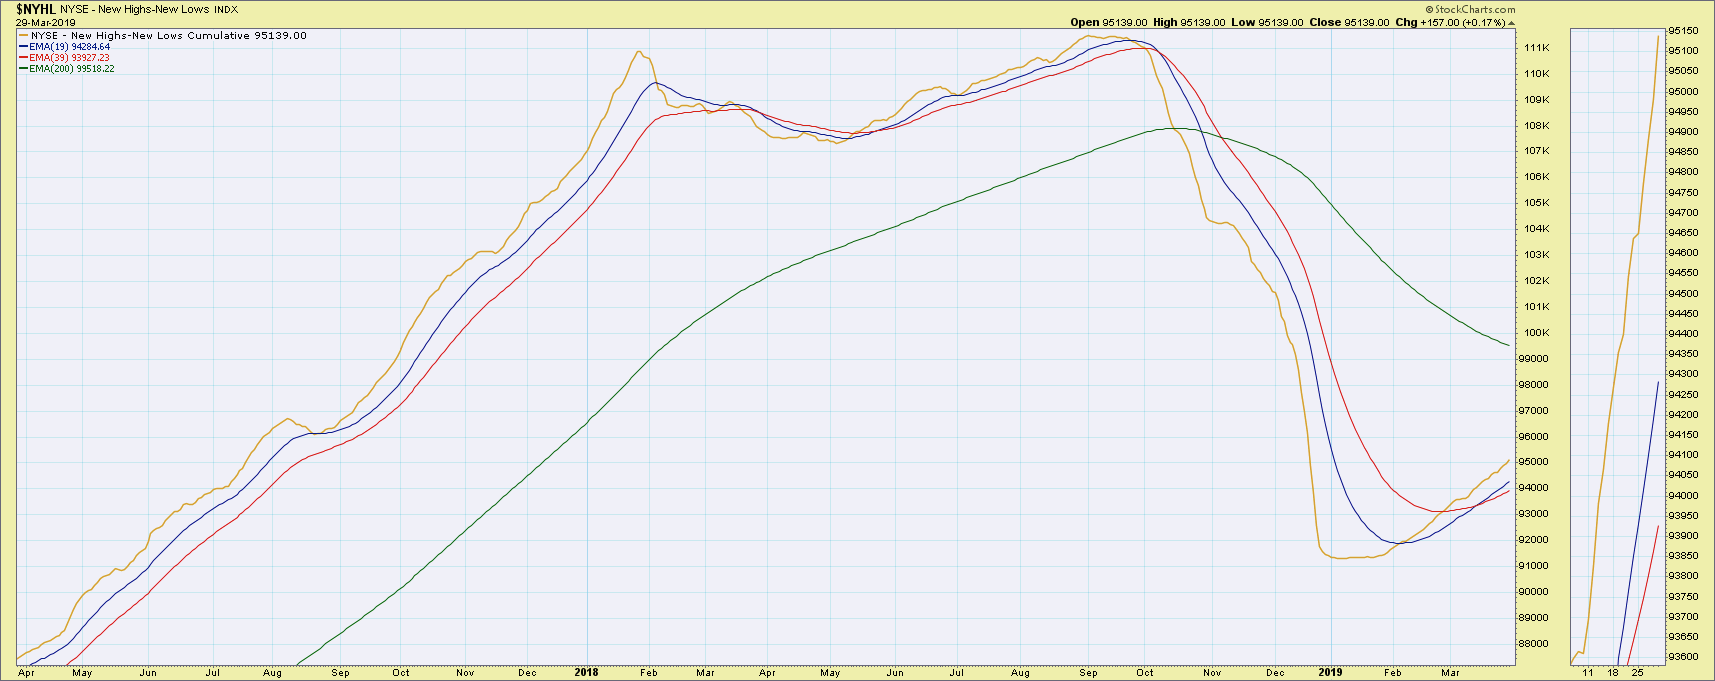
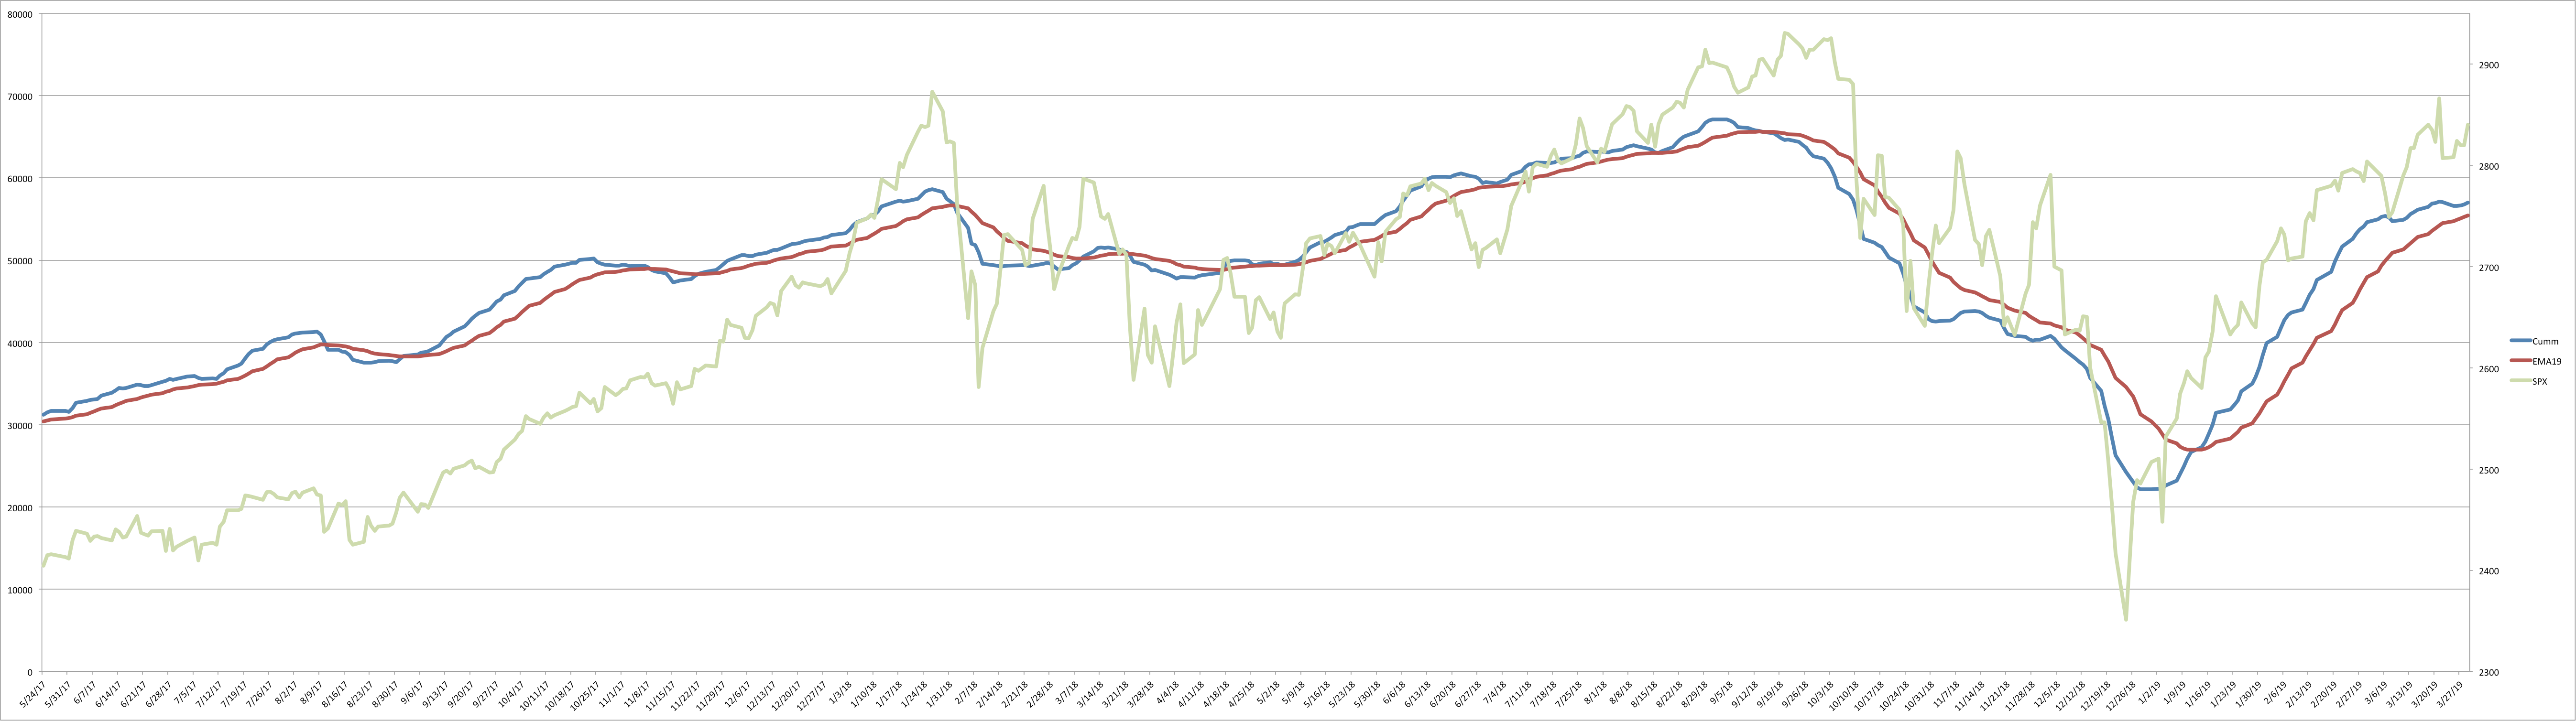
I have written about the NYHL system in detail here. I also backtested the NYHL1M system and presented results here.
I will, however, note that the conclusions from this study are being revisited by me at the moment and I will likely be taking the micro signals within the context of the NYHL1M buys and sells to time my trades better.
Pivots, Supports and Resistances
Every day in my reports, I share values of daily pivots, R1, R2 resistances and S1, S2 supports. These are canned values from my trading platform but they can be effective for intraday trading. I have written on how to use pivot points for your trading here.
Grey zone supports and resistances: These are zones I mark in grey on intraday ES charts drawn by me discretionarily based on earlier reaction points on current and different timeframes and also based on market profile information. These zones can be used for fine tuning entries on larger timeframes or for intraday trading depending on what you are doing.
Reports
The ES Daily report is posted every day except for Mondays and the Weekend report on Sundays which covers Monday’s information. The GDX and Bonds reports are posted on alternate days in the room. Information on the ES is generally more accurate than the GDX/Bonds information based on my observation, but these too have periods of higher and lower accuracy.
Core/Long-Term Indicators and Trading Signals Tables
In addition to our daily reports analyzing the Emini S&P 500 (ES), Bonds, and GDX, the Smart Money provides directional alerts on the ES, listed in our Core Indicators and Long-Term Indicator tables. It also provide Trade Signals in the QLD/QID and SSO/SDS based on its indicators.
Core Indicators include the NYHL1M and Secret Indicator Combo. The Long-Term Indicator is NYHL, which is the 12-month version. Trade Signals are my own discretionary set-ups, using the NYHL1M as the main input for entries and exits.
How do you use all of this information to trade?
-
The easiest way (though maybe not the most efficient) is to follow my trade signals. They will not be frequent, and I try to time my entries and exits within the context of what NYHL1M is doing and then fine-tune entries based on the Razzmatazz indicators and supports/resistances.
-
A little bit slower but completely mechanical is to follow the NYHL1M longs and shorts. Advantage is that you will be completely mechanical. Disadvantage is that there will be drawdowns and giveback of profits before a signal ‘turns’. This one could turn out to be more efficient than No 1. in the longer run.
-
A more proactive way would be the same as above BUT hedge your buy or sell positional trades when the secret indicator combo is pointing in a different direction than NYHL1M.
Which way you choose to go depends on what you are trying to do. So make the decision after going through history or observing what the indicator does for some time. The NYHL, the 12-month version, is very slow, and if using this it should be for long-term accounts only. The grey zones, pivots, etc., can provide a lot of useful tools for day trading. And the direction of the Daily Razz can offer lot of direction on short-term trading. The nature of open interest is such that it will change very quickly, so adjusting to changing views is required if using the information.
