The Boeing Company (BA) - Wheels Up?
 By
By
Written by Mark Malinowski with charts and commentary by Zac Mannes and Garrett Patten

Saying that Boeing has been in the news over the last decade for all the wrong reasons is a big understatement. If one was looking at the stock in a vacuum it might appear that stock price has tracked both the ascent and decline of the Max 737 airplanes since 2015. However, if I asked individuals to place these moments on the chart, I think many would be hard pressed to do so.
Timeline:
Late 2015 - First Max 737 rolled out of the Boeing factory.
January 2016 - Max 737 performed its initial test flight and the stock price took off with it.
October 2018 - Lion Air flight 610 crashed killing all 189 occupants on board.
March 10, 2019 - Ethiopian Airlines flight 302 crashed killing all 157 occupants on board.
March 13, 2019 - President Trump grounds 737 Max airplanes
December 2019/ January 2020 - CEO Muilenburg resigns/ CEO Calhoun appointed
March 2020 - The world shuts down and many countries have citizens “isolate at home”
April 2021 - South West Airlines large Max 737 order is placed
2023 - Multiple recalls and safety notices
January 2024 - Alaskan Airlines flight has door plug incident, FAA grounds 737 Max planes for investigation/ Following investigation, 737 Max production is capped by FAA
July 2024 - Boeing appoints Ortberg CEO and announces plans to reacquire Spirit Aero Systems
November 2025 - FAA approves production increase for Max 737
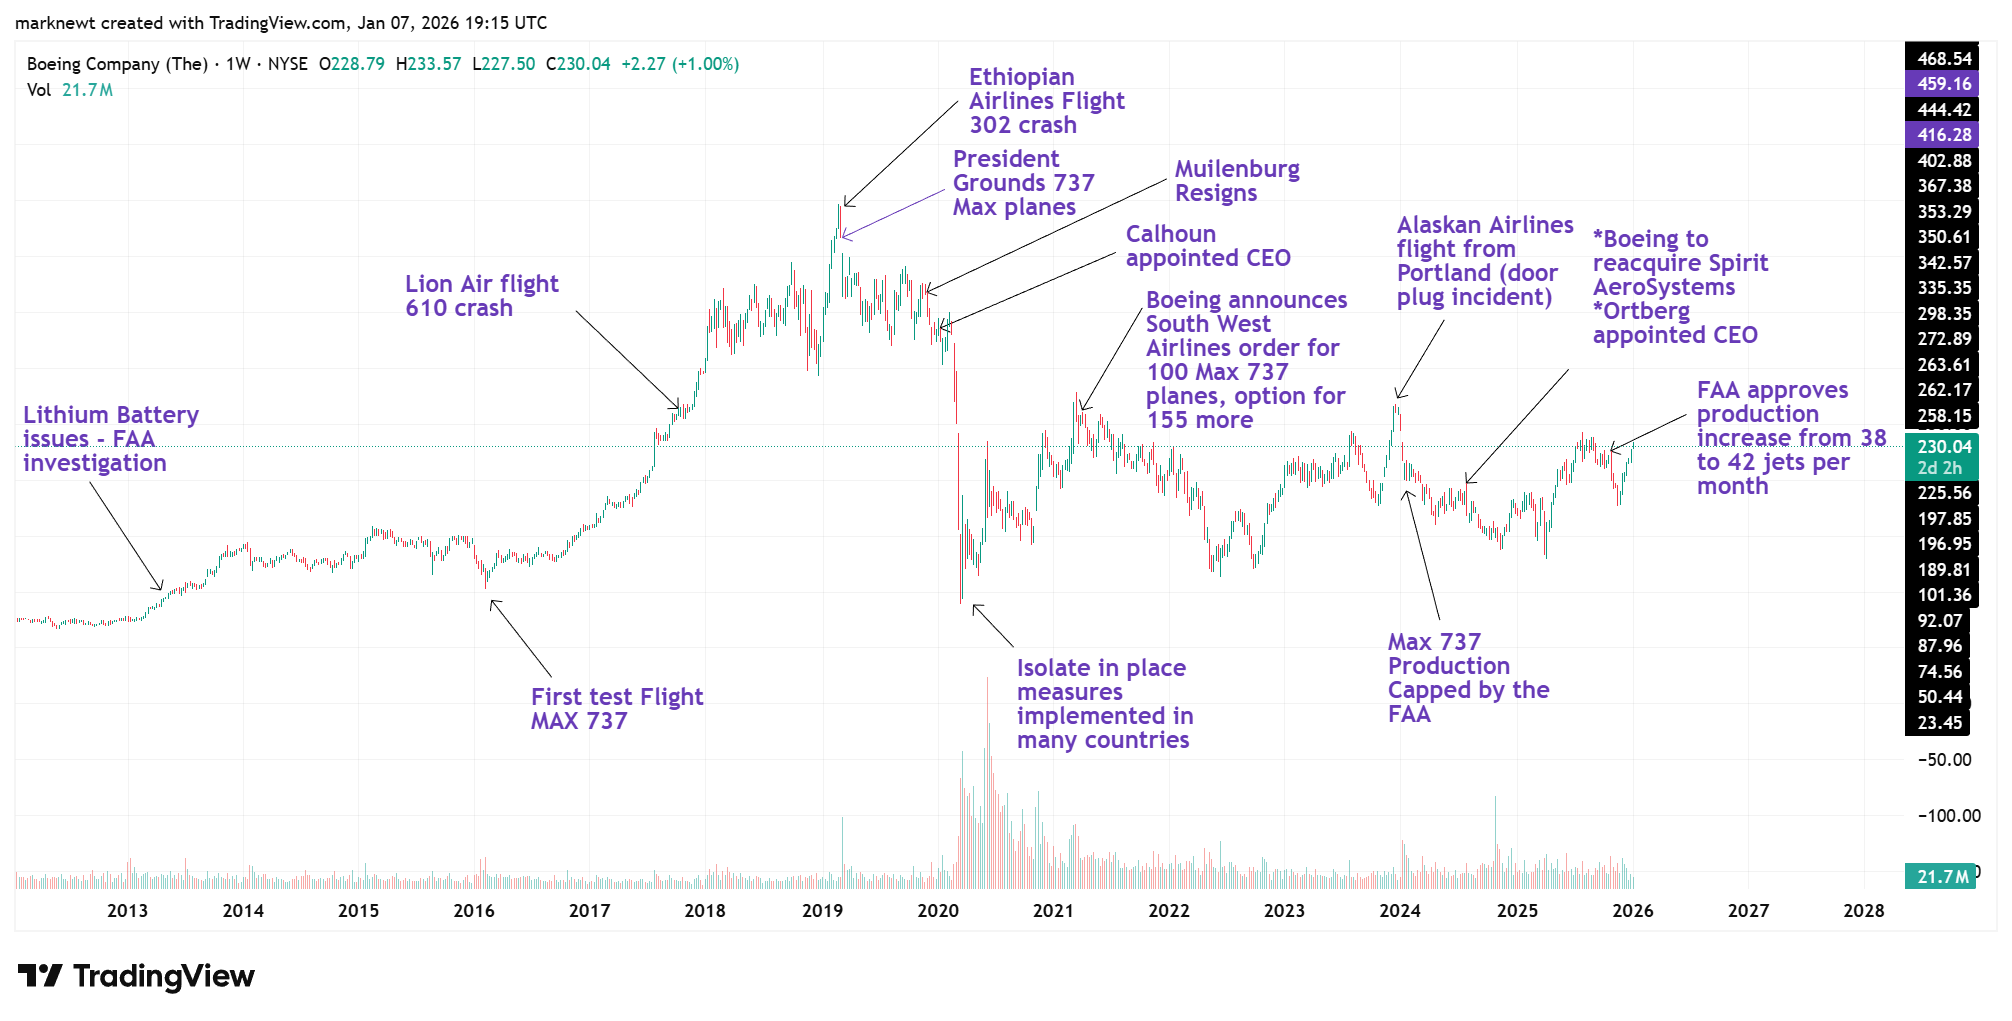
BA - News events on chart
While some see the appointment of Kelly Ortberg as a key turning point for the company, in hindsight the stock chart clearly shows it didn’t do much to sway public opinion. Looking at the big picture, those with the perspective of being ahead of the news and being in the know wouldn’t have changed the ability to trade this chart. As the vast majority of these events had little to no effect on the chart from a trading perspective.
What do forecasted earnings have to say about Boeing (BA)?
Forward Looking Earnings
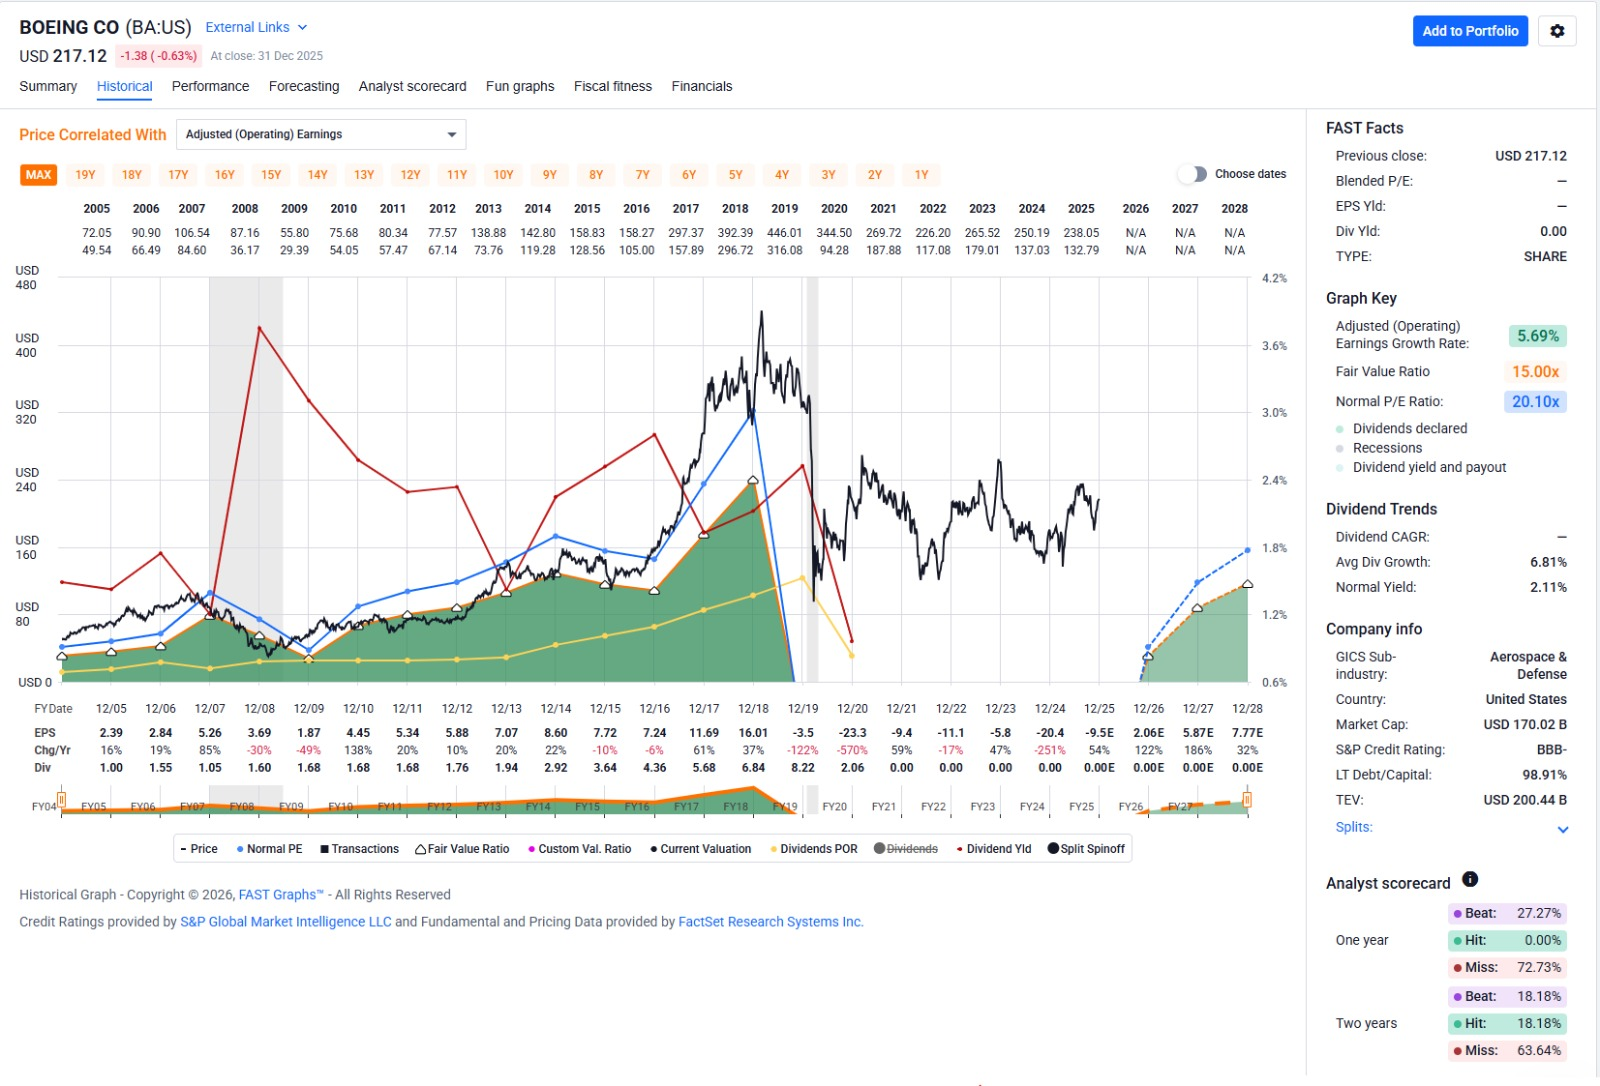
Boeing has been skating on some thin ice as they have dealt with quality control issues on the 737 Max but they are forecasting a return to positive earnings in the not so distant future. Could a return to the positive be a catalyst for bigger picture targets for Boeing. There certainly is potential from a technical perspective, even if it is more than a little murky in the near term from a fundamental perspective.
What if we look at the chart from a technical perspective?
Elliott Wave Analysis
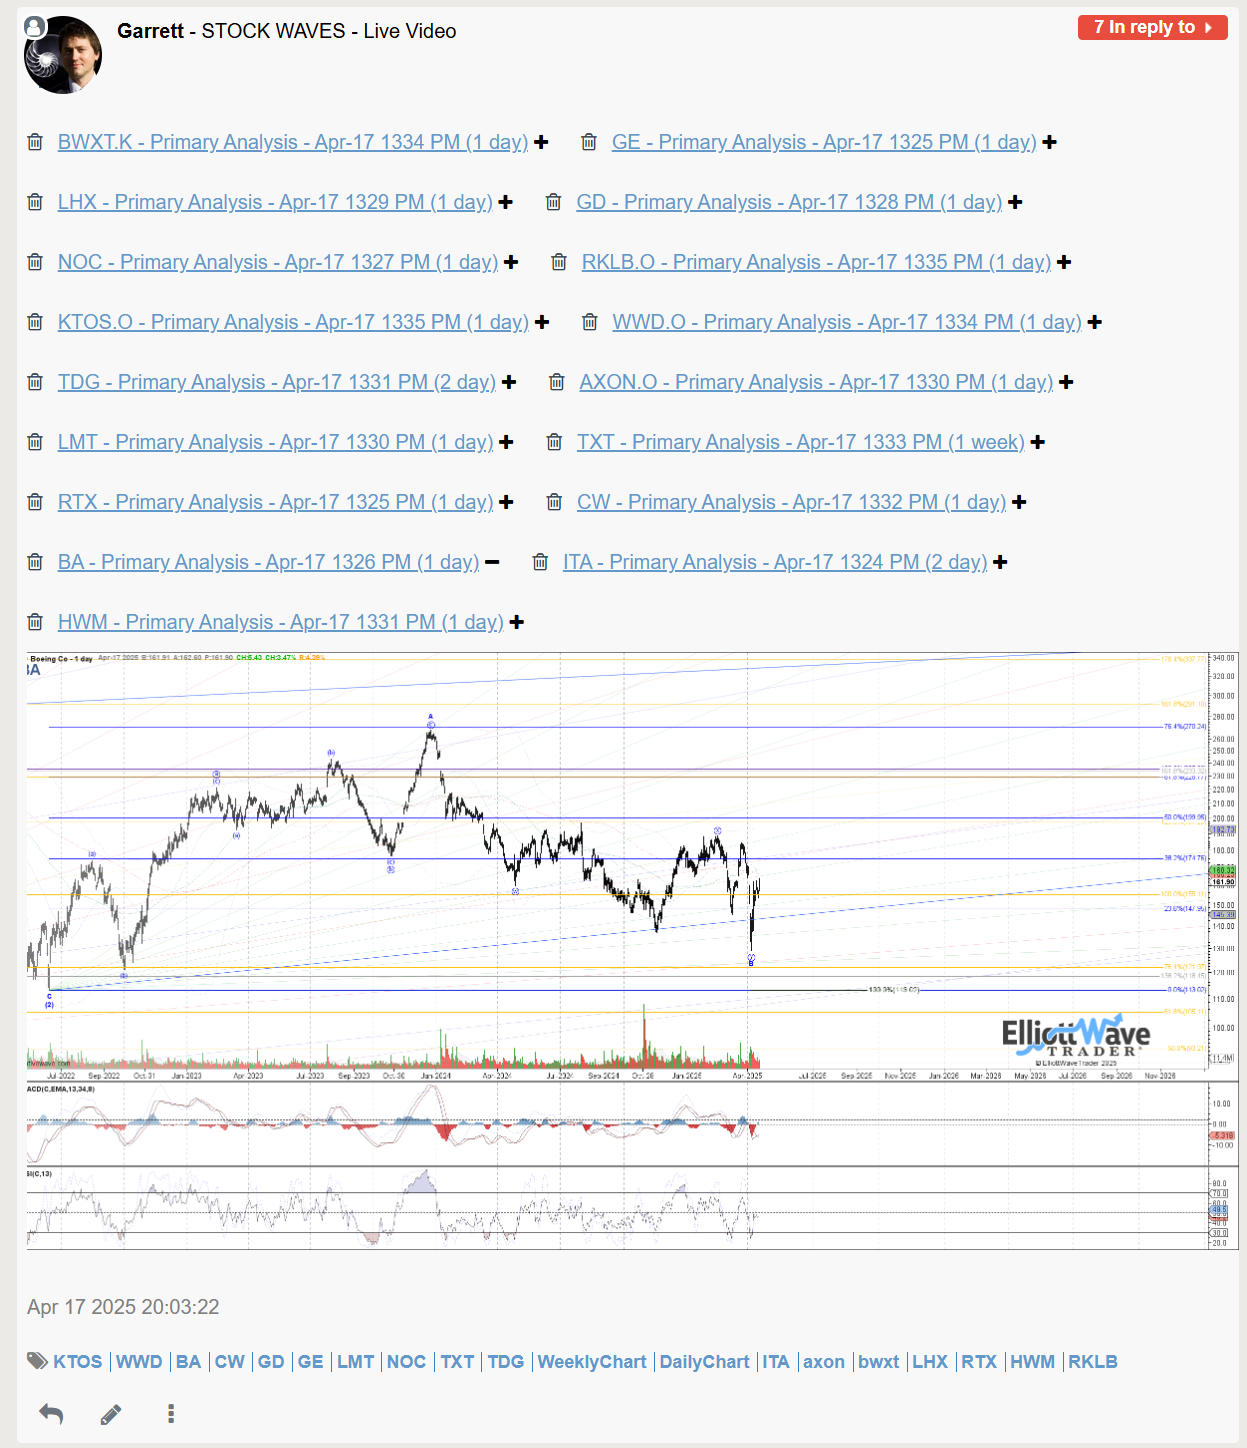
Back on April 17, 2025 Garrett Patten highlighted the strong potential for a large degree bottom to be in place April 10th in a Live Video to Stock Wave Subscribers:
Fast forward to July and strong 5 waves up, Zac has this count as one degree higher, highlighted the potential that price had topped in wave 1 and was looking for a wave 2 pullback closer to the 180 region.
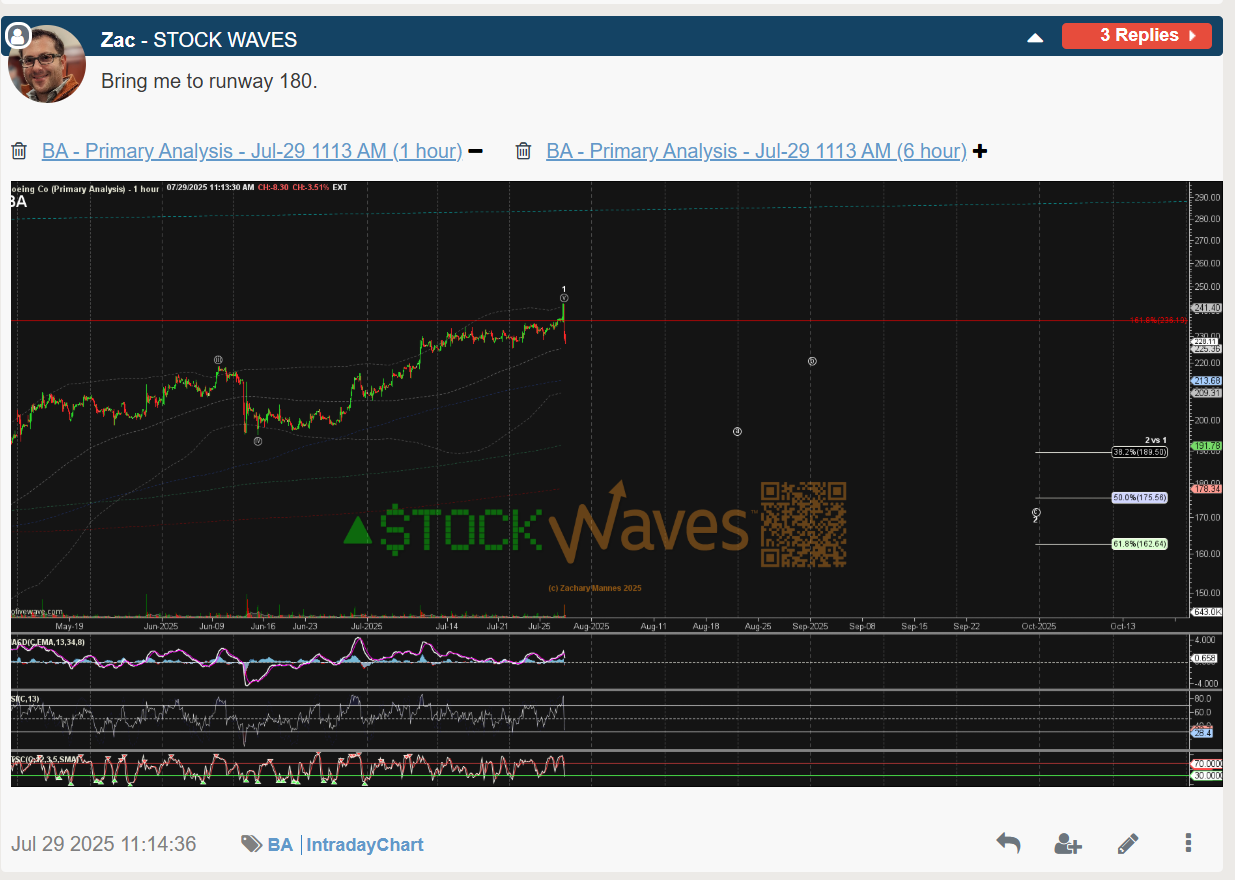
This being a 5 wave move Zac was looking at both the support level for wave circle iv and the top half of standard support between 189 and 175 as the next place he would be looking for a turn.
Zac’s July analysis proved to be spot on as price bottomed at 176.79 on Nov 21st, but back on November 18th, he highlighted BA again on Charts of the Day video for subscribers, saying he sees room for lower, but that a move directly lower favored a bottom being attempted for 2 vs just a bounce attempt in yellow circle b.
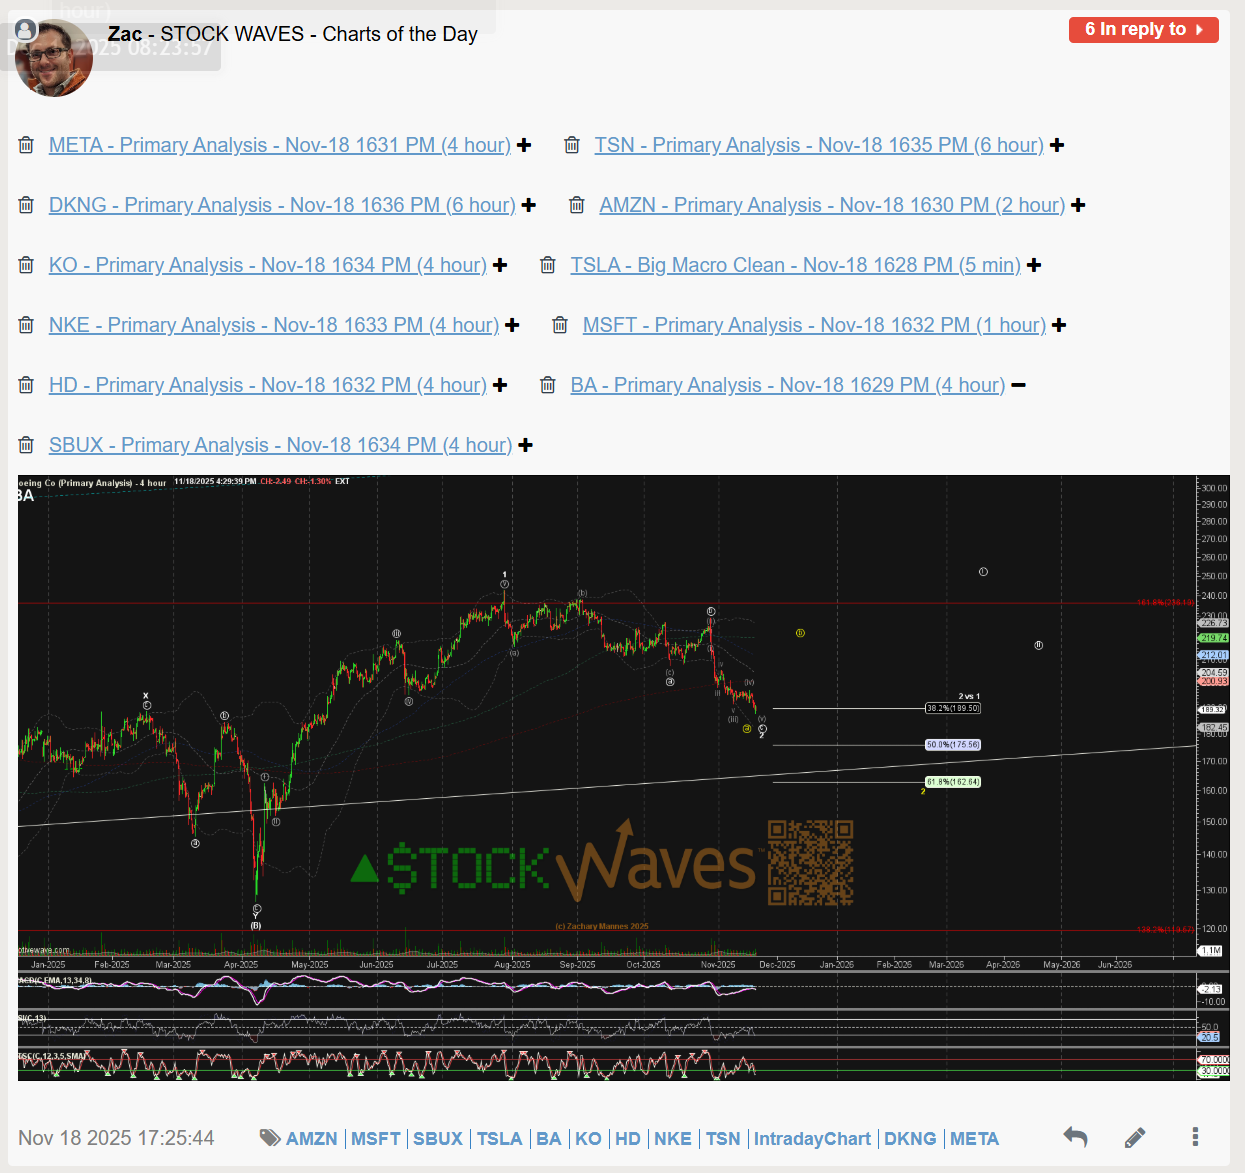
After price moved over initial resistance Garrett and Zac made this chart an official Wave Setup x2, one looking at Months and one looking at Years!!:
Note: This had previously been made a Wave Setup that invalidated when price poked below $145 in early April. This coincided with the break of the November 2024 low but was still tracked as a bullish structure, even if not a new formal Wave Setup since December 2025.
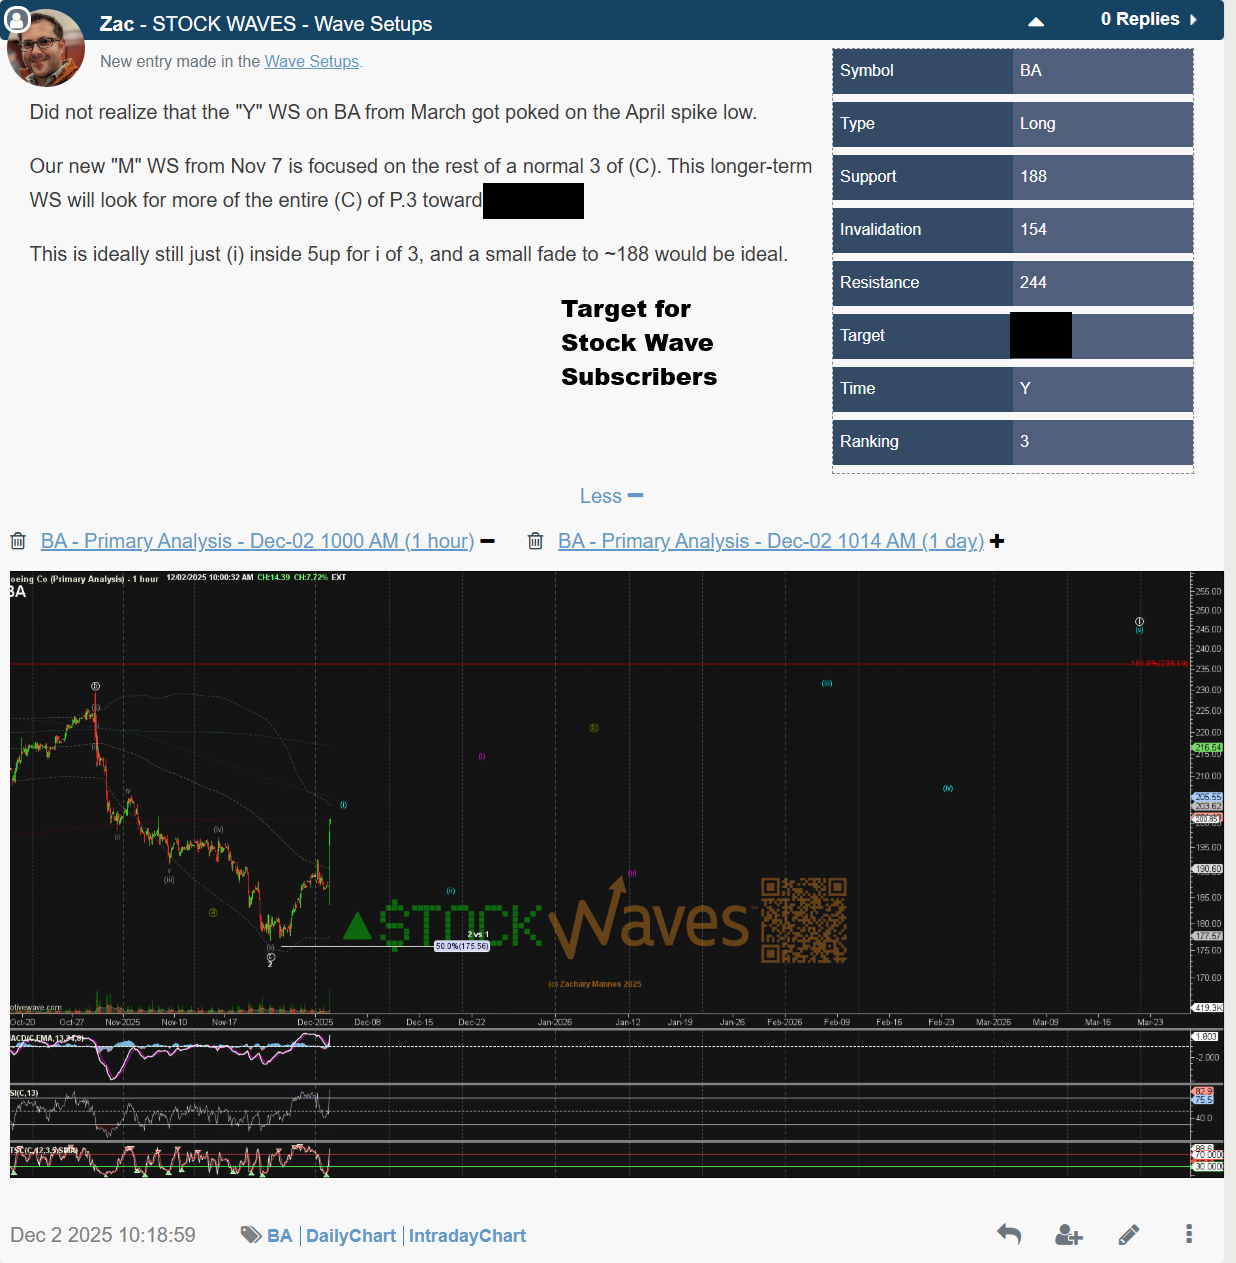
What is a Wave Setup?
A Wave Setup is the Stock Waves way of stating clear parameters for resistance, support and invalidation based on Elliott Wave theory structures and Fibonacci price levels. Only the cleanest and clearest patterns will receive formal Wave Setups.
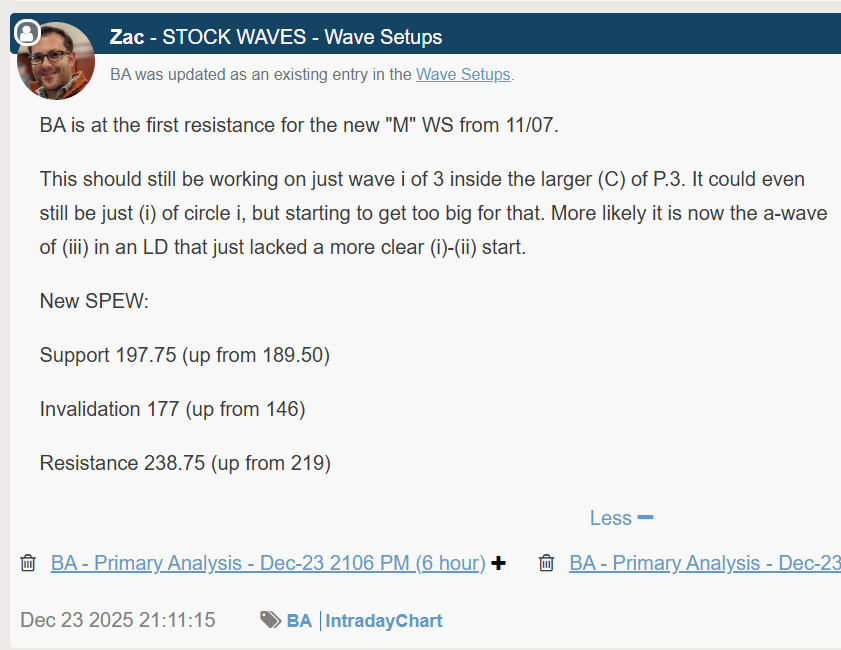
Zac has since provided a formal WS update on December 23rd for the Months setup, as price pushed over the initial resistance level and increased support and invalidation levels and included BA in multiple intraday updates and end of day videos.
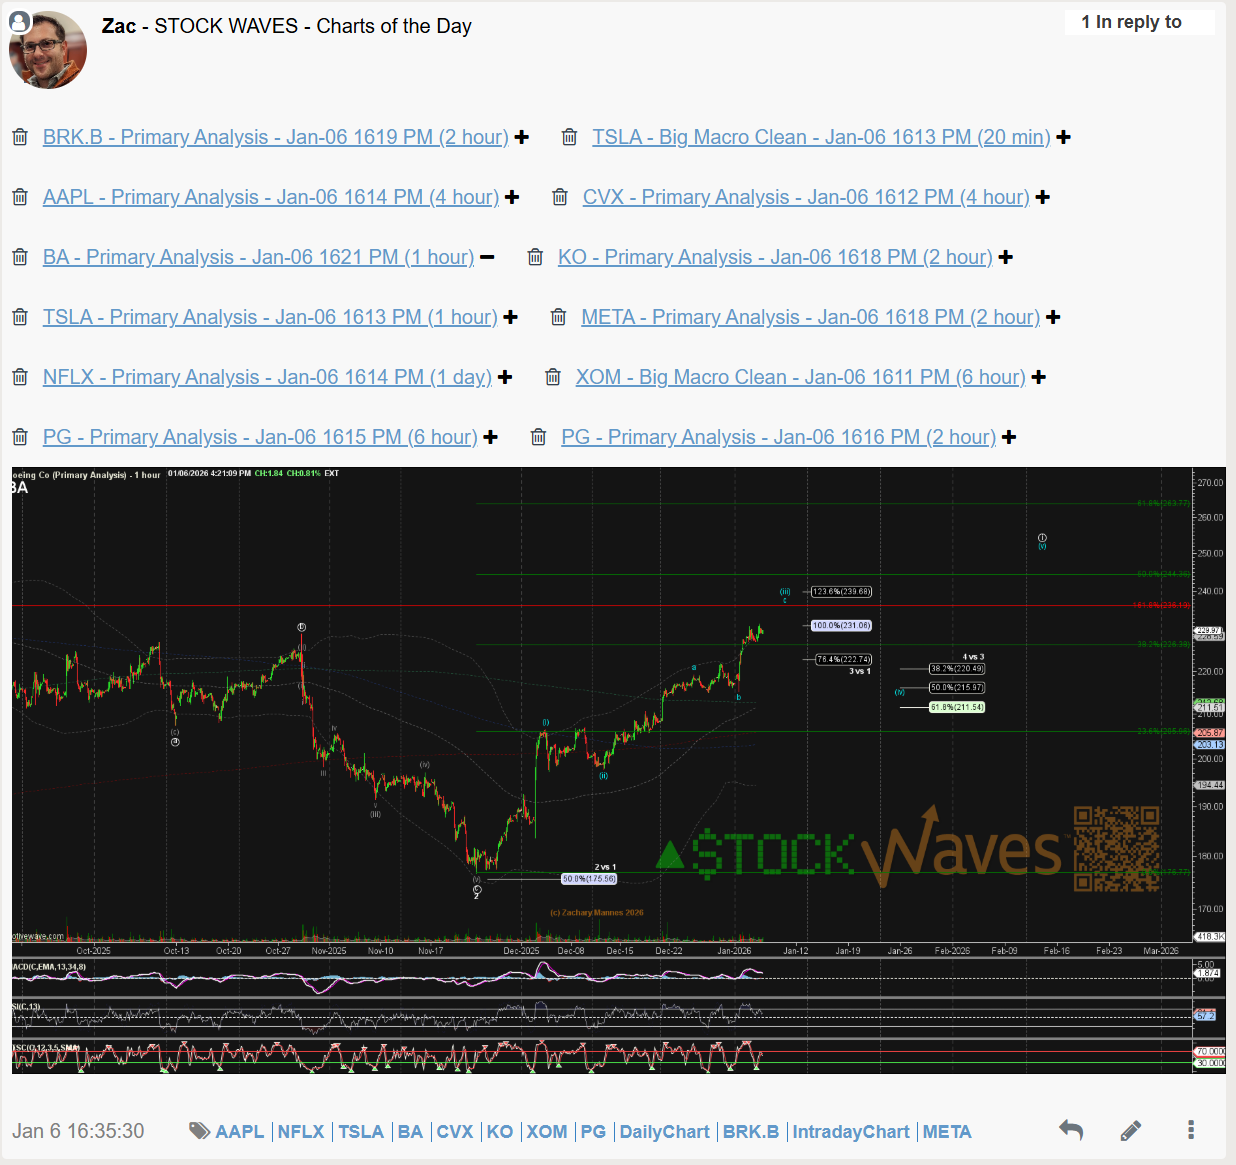
Highlighting the potential for a local top, Zac covered BA in another Charts of the Day video on January 6th.
We continue to track the push higher along with support and resistance levels in Boeing (BA) and many other stocks.
What happens after wave circle i, if we get to Garrett and Zac’s target?
Elliott Wave Theory says, next comes wave circle ii, so if/ when a top is established for wave circle i, we will again provide analysis and potential pricing for a wave circle ii pullback.
If you appreciate the step by step, support and resistance approach along with a structured approach to risk management, come and check out what we do at www.elliottwavetrader.net
