Testing Support Zone - Market Analysis for Oct 15th, 2023
 By
By
From last weekend’s update:
Price action is bullish short term, bearish/neutral medium term and bullish long term…
We saw seasonal patterns continue to play out.. It is likely we saw the low of the move mid week but we would need to clear the 4380 and then the 4440/50 area to confirm this. Usual patterns for the third year of the presidential cycle have us setting a low in the first week of October. This year also played out in a similar fashion. After the strong move on Friday, we likely have some backing and filling ahead of us into the 4300 area before continuation higher. Internals improved on Friday but majority of them remain on sell signals - this is very likely to change in the coming week. Odds is on a buy signal and is suggesting that we may be very close to a bigger trending move higher after some pullback/basing action… 4300/4280 is support and 4360/4370 is resistance.. expect some choppy action between theses two areas before we get a decisive move..
What actually happened:
Got very close to the 4440 area on the Emini S&P 500 before selling off.
Pivots/Zones:
ES Grey Zone areas - The grey zones on the ES 5 min chart below are what I draw in on a discretionary basis - they are supports and resistance areas which the market is most likely to react from. If we test a zone from below, it is likely to be rejected and fall lower to test support zones below. If we test a zone from above, it is likely to take support there and begin a move higher. So these zones can be used for intraday trading and/or as entry points for positioning for swing trades. These zones are drawn in based on what the market has done there previously both on smaller and larger timeframes.
Grey zone resistance at 4415-31 and then 4463-80. Support is at 4356-41 and 4305/4292..
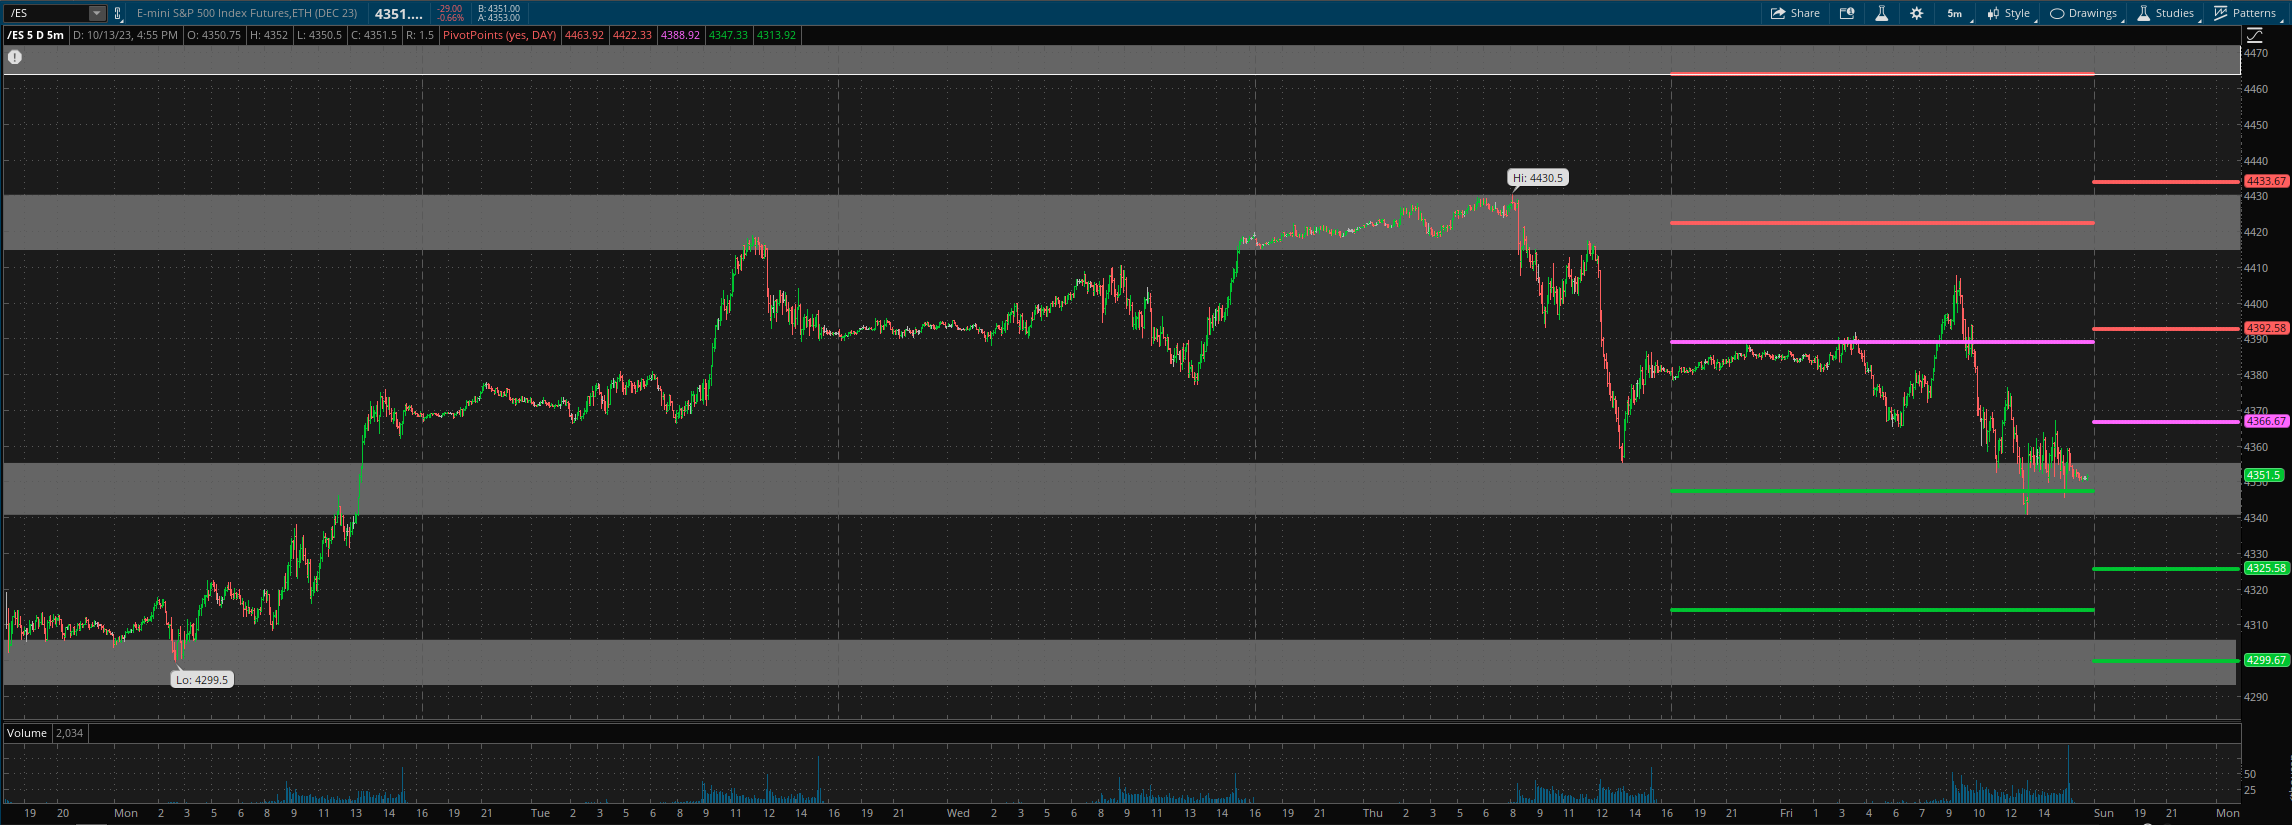
For Monday, daily pivot is at 4366.5. Resistance R1 is at 4392.5 and R2 at 4433.5. Support S1 is at 4325.5 and S2 at 4300.
Summary/What next for this week?
Price action is bearish short term, neutral medium term and neutral long term.
After hitting a high of 4430, market sold off and is now testing the 4350 support zone on the Emini S&P 500. Internals were improving as we rallied last week, but have since taken a hit with the relative weakness in small caps. Our Odds Indicator went a sell signal, but this can go back to a buy depending on what happens in the next few days.
This is not an easy area to call or navigate right now and I can make cases for both bull and bear scenarios playing out, but I slightly favor some more downside into the 4300 area and then a possible rally setup from there. If 4300 support is lost, then it is likely we are directly going to new lows. Seasonally the coming week is on the weaker side, but things begin to improve afterward into the latter half of the month. On the upside, 4375/80 is resistance, and clearing this opens up a test of the 4400/4410 area again.
All the best to your trading week ahead.
