Tesla ($TSLA) - The end, the beginning or somewhere in between?
Written by Mark Malinowski with charts, commentary and analysis by Zac Mannes

Model S Experience
Suggesting Elon Musk is a polarizing figure isn’t news. Saying Elon Musk is a highly intelligent man who has spent large amounts of time thinking about the world, the future and is actively working to shape that future might be taking his thought exercises too far. The fact that he owns or controls interest in companies leading the fields of electric personal transportation, personal robotics, artificial intelligence, rapid communications, space transportation certainly gives the appearance that he is betting on the future. However, one could also say that he has taken his skills in the area of influencing mass sentiment to a high that makes Steve Jobs “reality distortion field” seem small by comparison.
The cult-like following of Tesla is one example of many where reality did not meet expectations. The company regularly gives future delivery timelines of new products and misses those deadlines. The company has lost market share globally after BYD and other manufacturers have closed the gap with Tesla vehicle technology (excluding Full Self Driving) and undercut them on price. While market share has remained fairly consistent in the US, the loss of government incentives and what some might view as a political reaction, have reduced overall electric US sales.
The company is often perceived by those using fundamental measures as grossly over valued and given valuations that suggest the company would need to be 90% lower in value for them to be interested in it. However, as I described above the company is often viewed as a bet on the future and the ability of its now chairman to hype/ create what is coming next and that it will be coming soon.
The other side of the coin is that some folks claim massive valuations with projections that point into the multiple thousands of dollars per share, based on their own “personal brand of technical indicators.”
We often like to find the charts where there is good overlap between the underlying fundamentals of a company and the Elliott Wave pattern moving along in a predictable reliable pattern based on the chart history and the math that we apply to ratios of structures of the pattern. It is interesting that while we can see similarities to Bitcoin, Lyn Alden does not like to comment on Tesla because it trades so distortedly from traditional fundamentals.
So for those that haven’t been following along in 2026, what is happening with Tesla?
Tesla has recently shared that they are re-focusing their efforts from being a diverse vehicle manufacturer to refocus on a smaller range of vehicles and robotaxis, humanoid robotics and AI powered robotics.
Firstly, Tesla has identified a slow down in vehicle sales as a trend change in demand. Vehicles have gotten prohibitively expensive for large portions of consumers and sales of many auto manufacturers have certainly shrunk over the last 12 months. This makes sense given that an increasing percentage of the younger generations have not even bothered to get their license. The other end of the barbell is that seniors who no longer want the hassle of maintaining a vehicle can maintain independence. Tesla appears to be shifting with that demand and moving production and innovation focus to robo-taxis and the vehicles that they will use for that service. More recently they have announced timelines and production targets for Optimus, the humanoid robot, with first production in late 2027 targeting 1 million robots in annual production. This is forecast to be a large part of revenue on a go forward basis. Lastly, Tesla is leaning into their current competitive advantage in the Self Driving technology space to support their vehicle development, robo-taxi and robotics businesses.
All of this change clearly signals a significant shift from what many view as a vehicle manufacture, but others have long regarded as a future technology company. This shift will require significant investment with Tesla planning to spend $20 billion dollars in 2026 to refocus, create and ramp up production. All of this change can continue to provide positive or negative catalysts, but it does mean the relationship between price and structure of the chart are even more important to the way that we look at the chart.
Elliott Wave Analysis
Stock Waves at Elliott Wave Trader (www.elliottwavetrader.net) has covered TSLA since our virtual doors opened in 2011. We regularly cover it multiple times per day at very small degrees. That level of “intimacy” is usually reserved for the indexes, gold, silver and mining ETFs. Why then is TSLA given the seat of “honor” at our table?
Well that question has multiple good answers. First it is well suited to the application of Elliott Wave. Meaning it has proven to follow a reliable pattern and structure and second it is a very liquid equity with 50 to 150 million shares trading hands on a daily basis. Second, our subscribers have seen great value in the TSLA Wave Setups that we have noted for them. Price have hit targets allowing for members to choose to take profits or exit positions and wait for a new setup. Third, the chart being on the higher beta side of things, it makes regular moves of note relative to the market and therefore has a large following where we aren’t waiting for something “exciting to happen.” While not all charts can be successfully micro counted, I think that our analysts have shown that TSLA certainly can.
For those not familiar with our Wave Setups, we prove clear risk:reward parameters that we derive using Elliott Wave analysis combined with Fibonacci extensions and retracement levels. While some are as short term as weeks, most are months or years in duration and appeal more to those with a swing trading timeframe. We also don’t just define parameters to the upside, we also have Wave Setups that point to the downside.
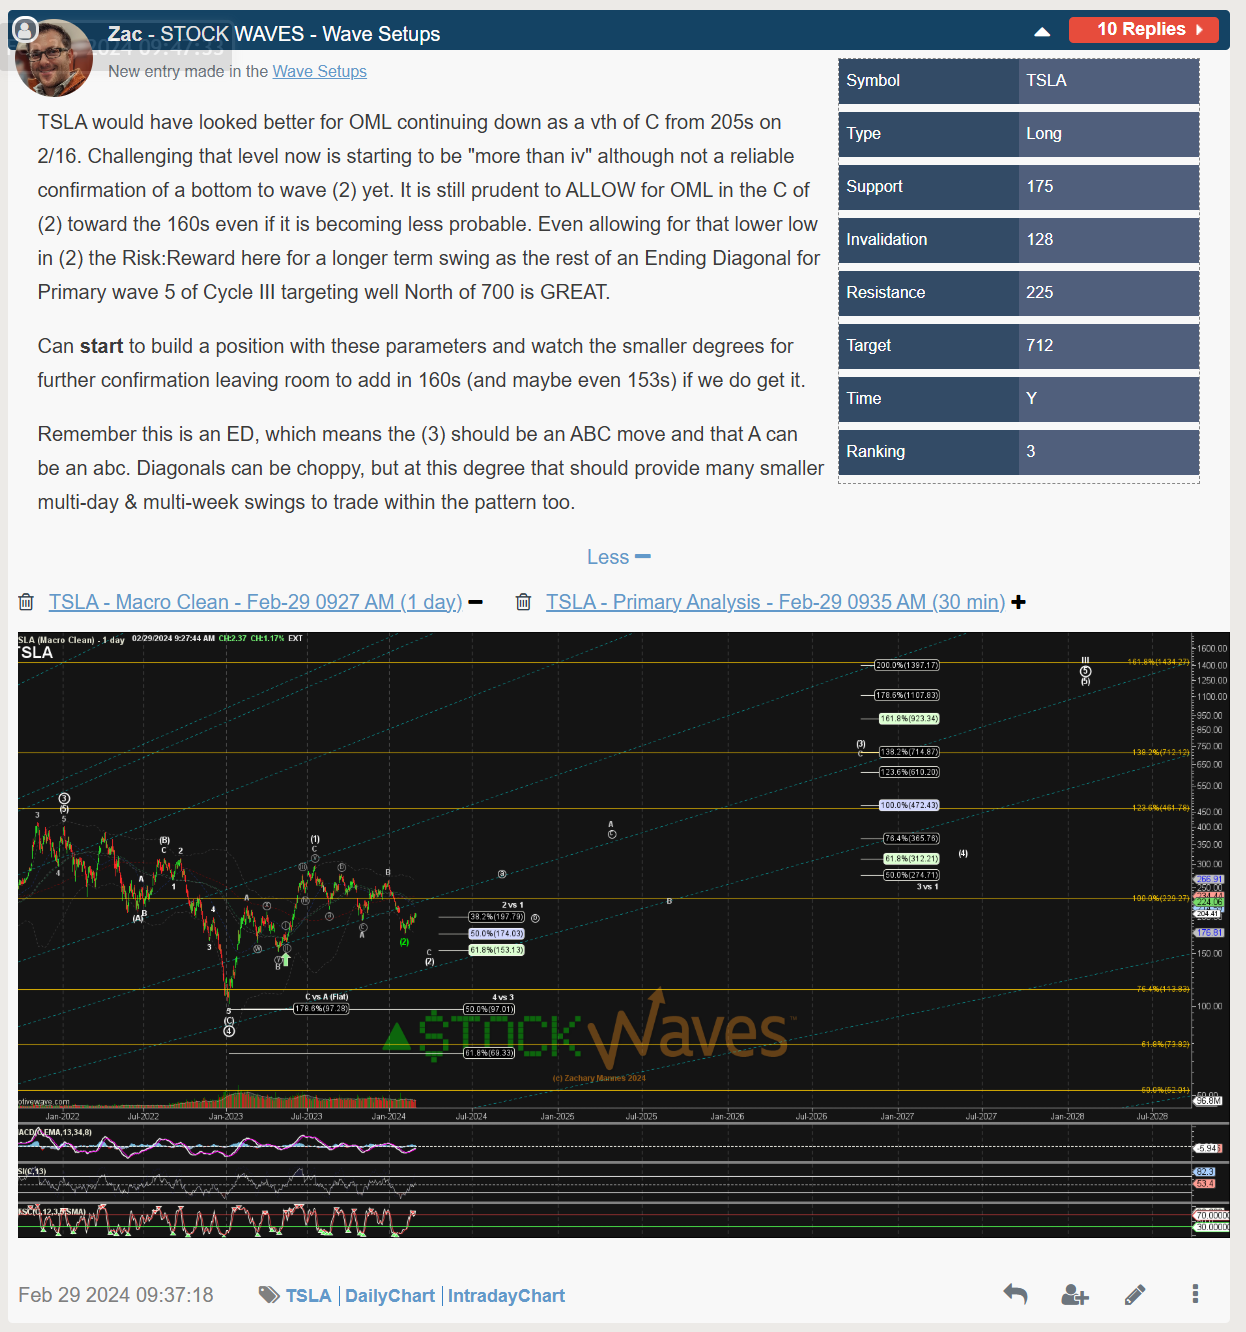
If I look back to February 2024, there was a newly created Wave Setup highlighting the potential for bottoming but we needed to allow for a deeper pullback.
The pullback did get a little deeper but certainly started chewing higher, prompting 2 more shorter term Wave Setups on July 29th and August 29th.
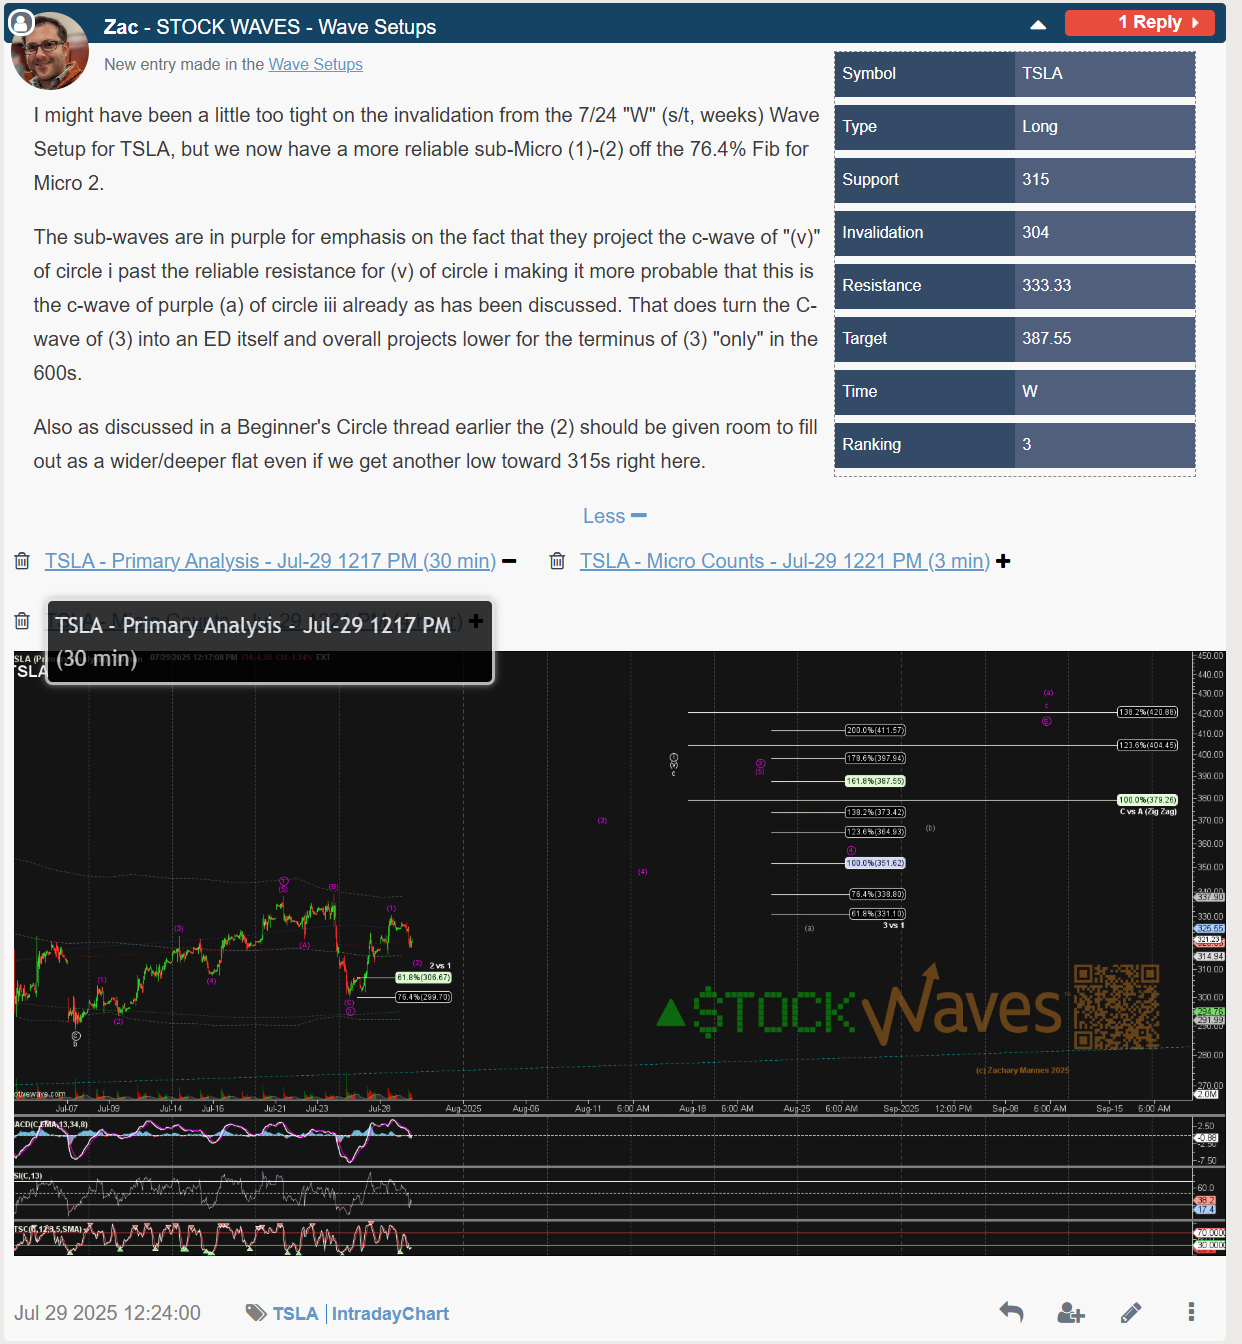
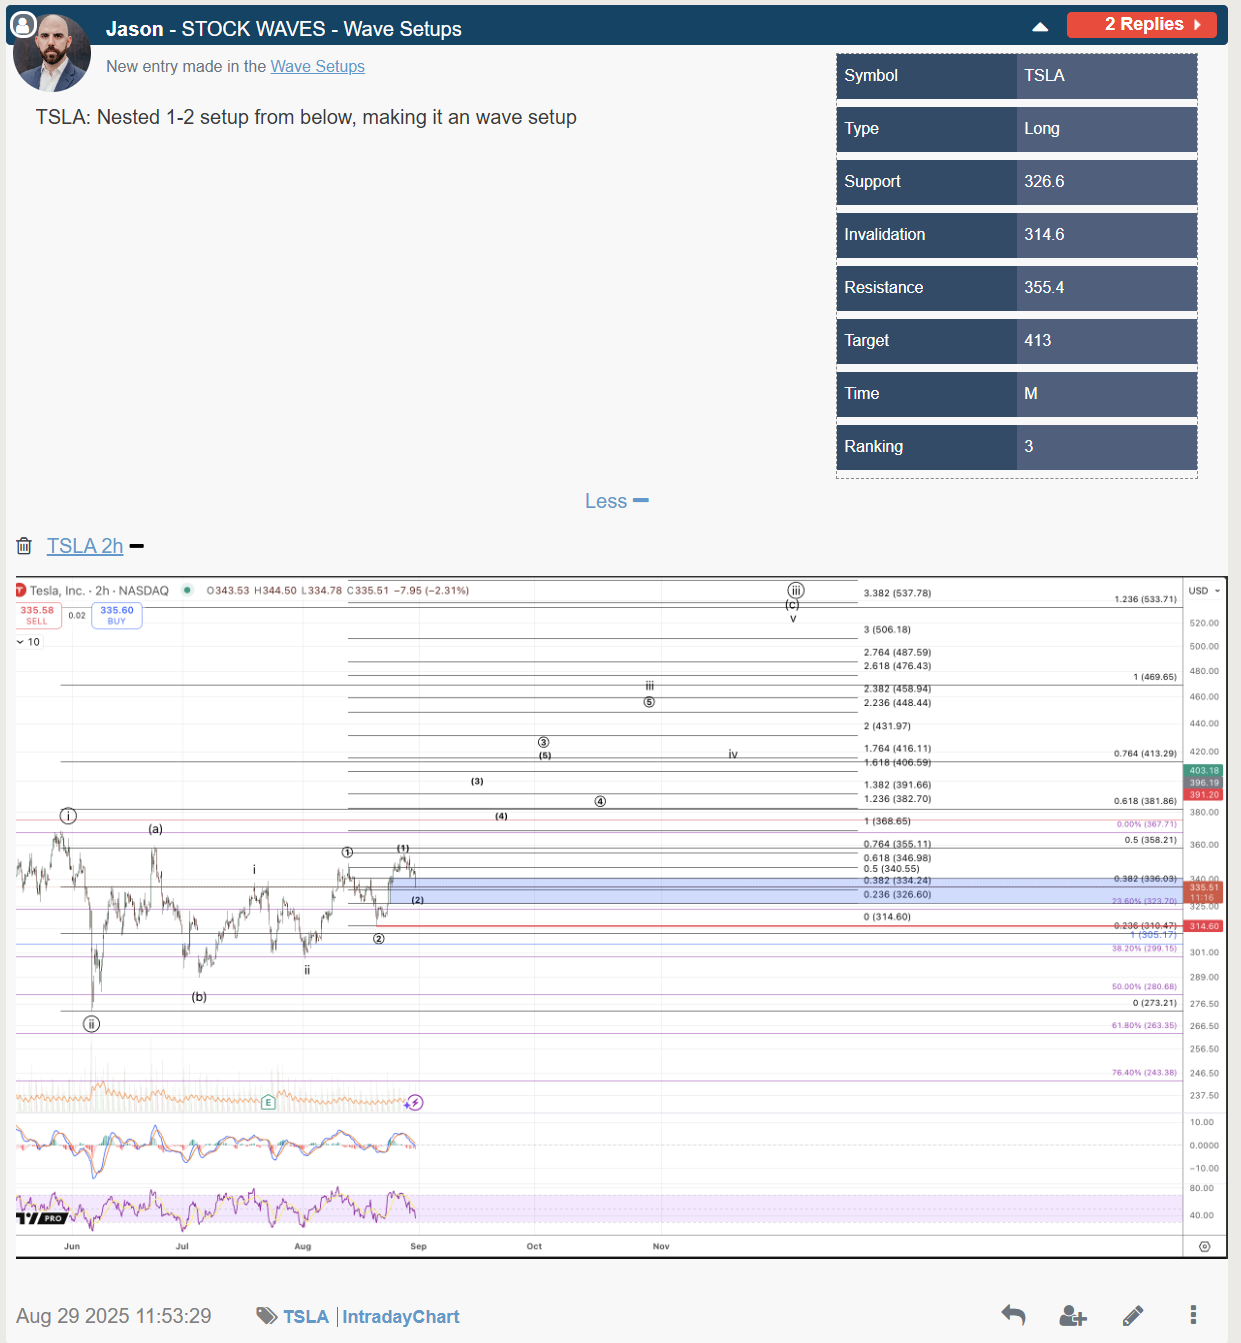
All three of these Wave Setups have been updated as price has progressed higher allowing analysts to move support and resistance levels higher over time.
So where does that leave us today? TSLA has filled out the predicted pattern from our Feburary Wave Setup very nicely. It has regularly displayed the kind of extensions (up and down) that make TSLA great to trade.
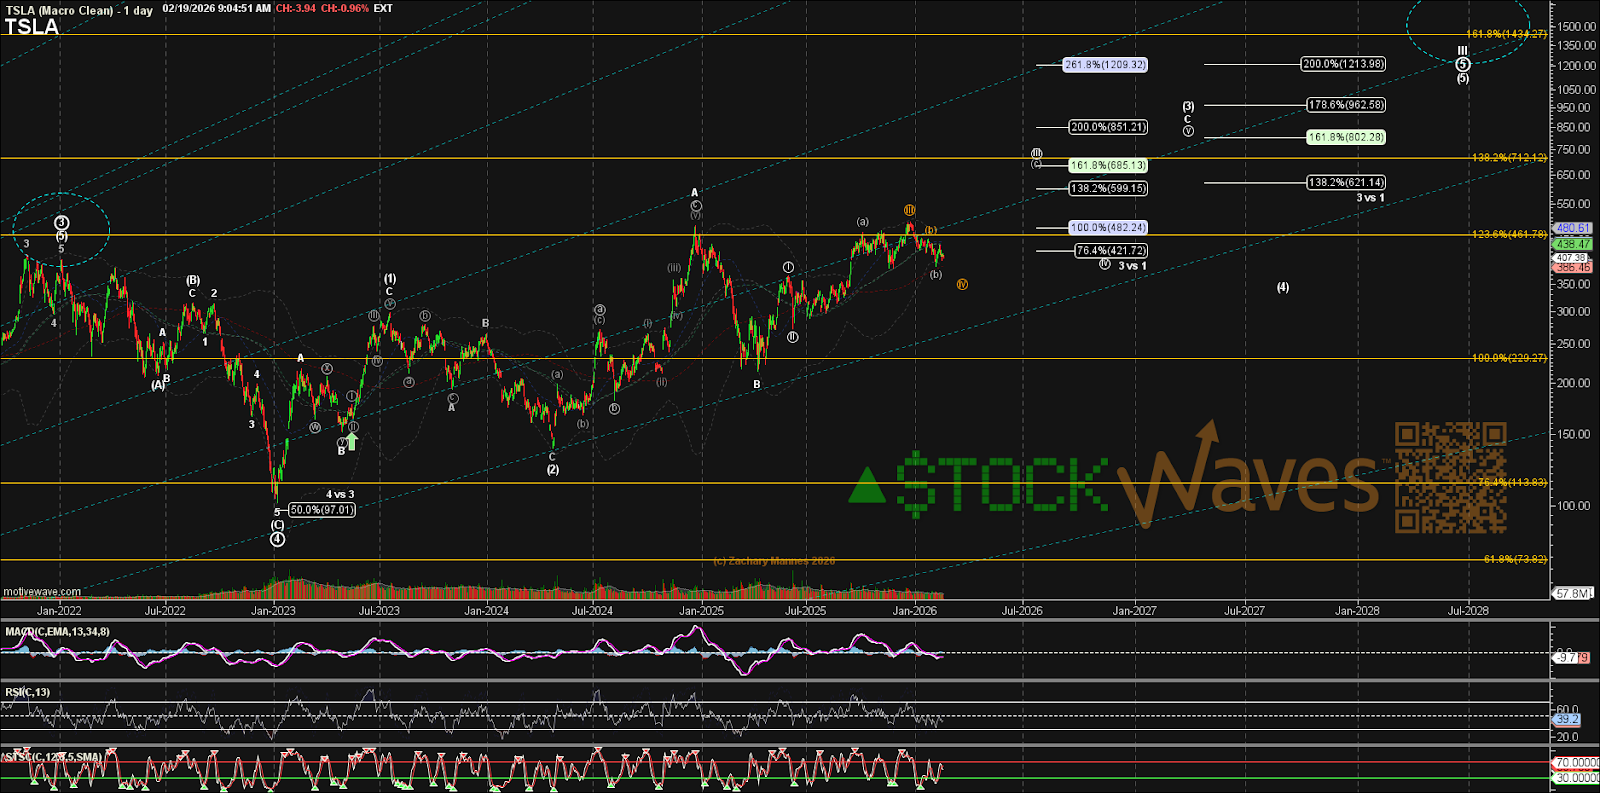
The “A” wave of (3) got considerably higher than initially projected back in Feb 2024, so much so that it technically can count as all of the (3). However as Zac has discussed on numerous occasions there are multiple confluences in the 1000-1400 region based on larger degree Fibonacci PinBall that continuing to entertain a larger (3) allows for. Just like we have in the third at that larger degree in the diagonal for Primary 5, inside our C-wave of (3) which itself is a diagonal we can count a larger than typical (a)-(c) of its third, a near perfect fractal.
For those not familiar with the word, fractal, it refers to patterns that are very similar at progressively smaller scales. Zac Mannes regularly discusses TSLA in his work internally and externally:
https://x.com/ZacMannes/status/1890078609248768466?s=20
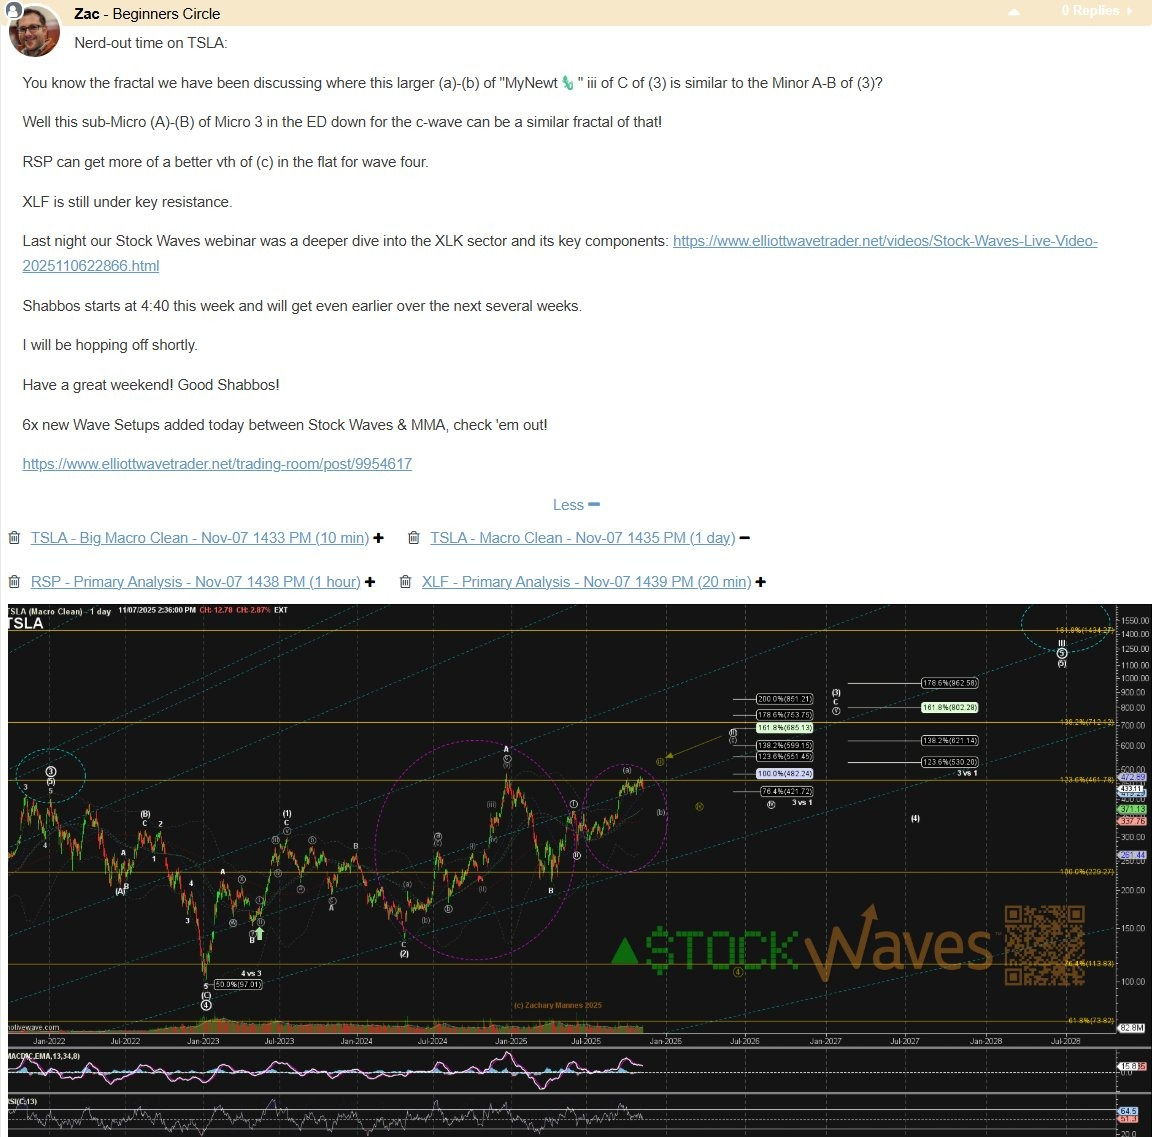
Price is attempting to confirm the start of this larger (c )-wave of circle “MyNewt” iii off the 388 region, should that low break the 360s would likely be tested as a greater risk of the alt orange iv shifting the C-wave to more standard proportions.
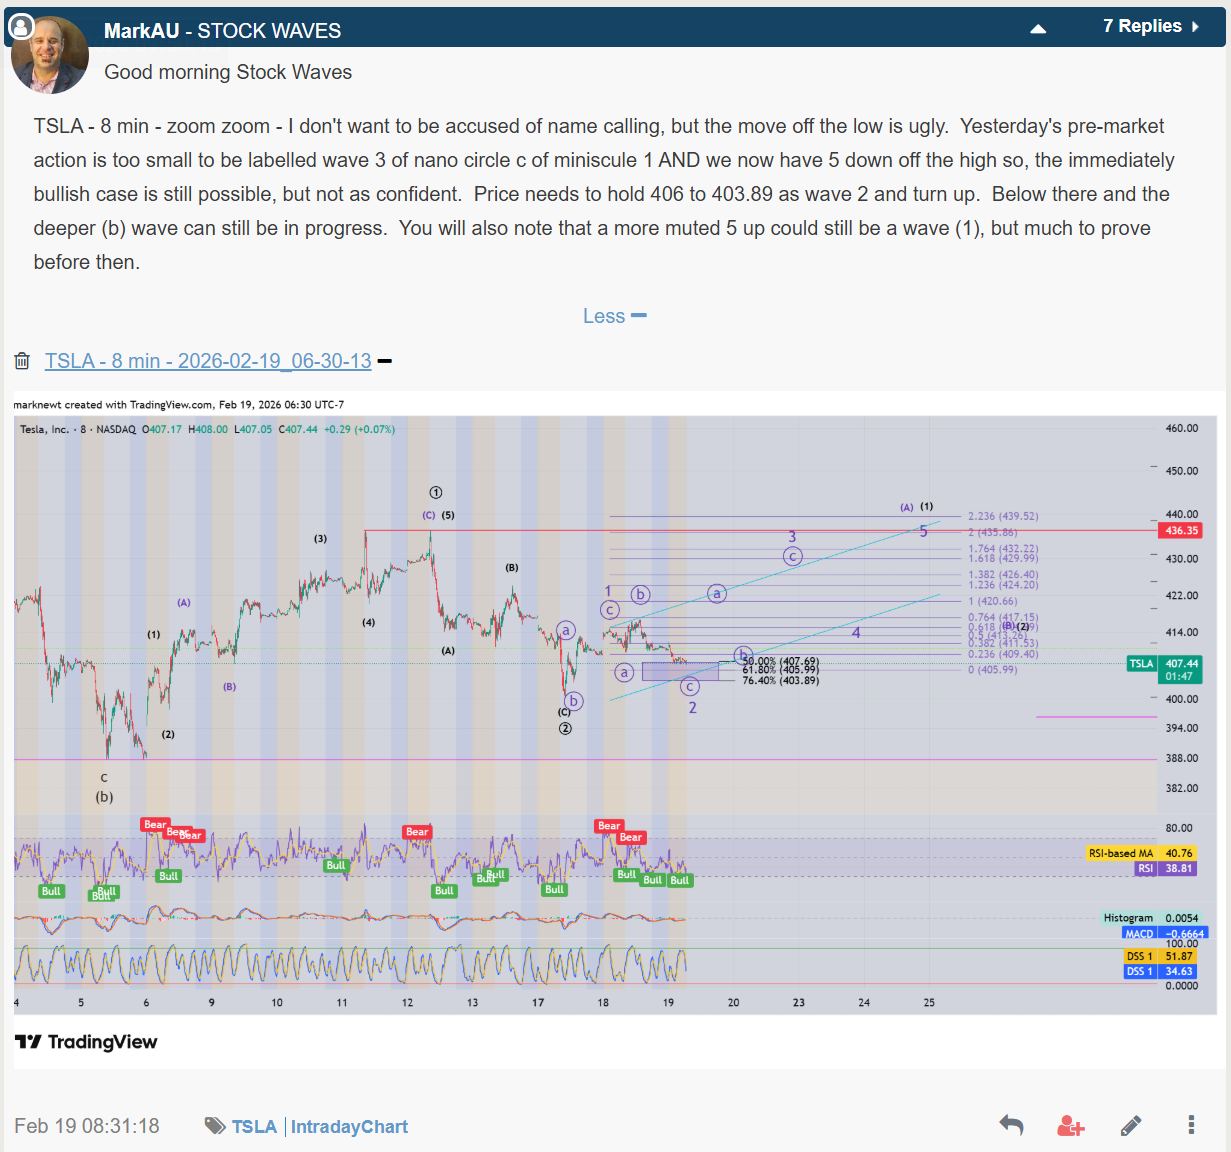
On the smallest scale, here is an example of a post on TSLA where we look into the micro:
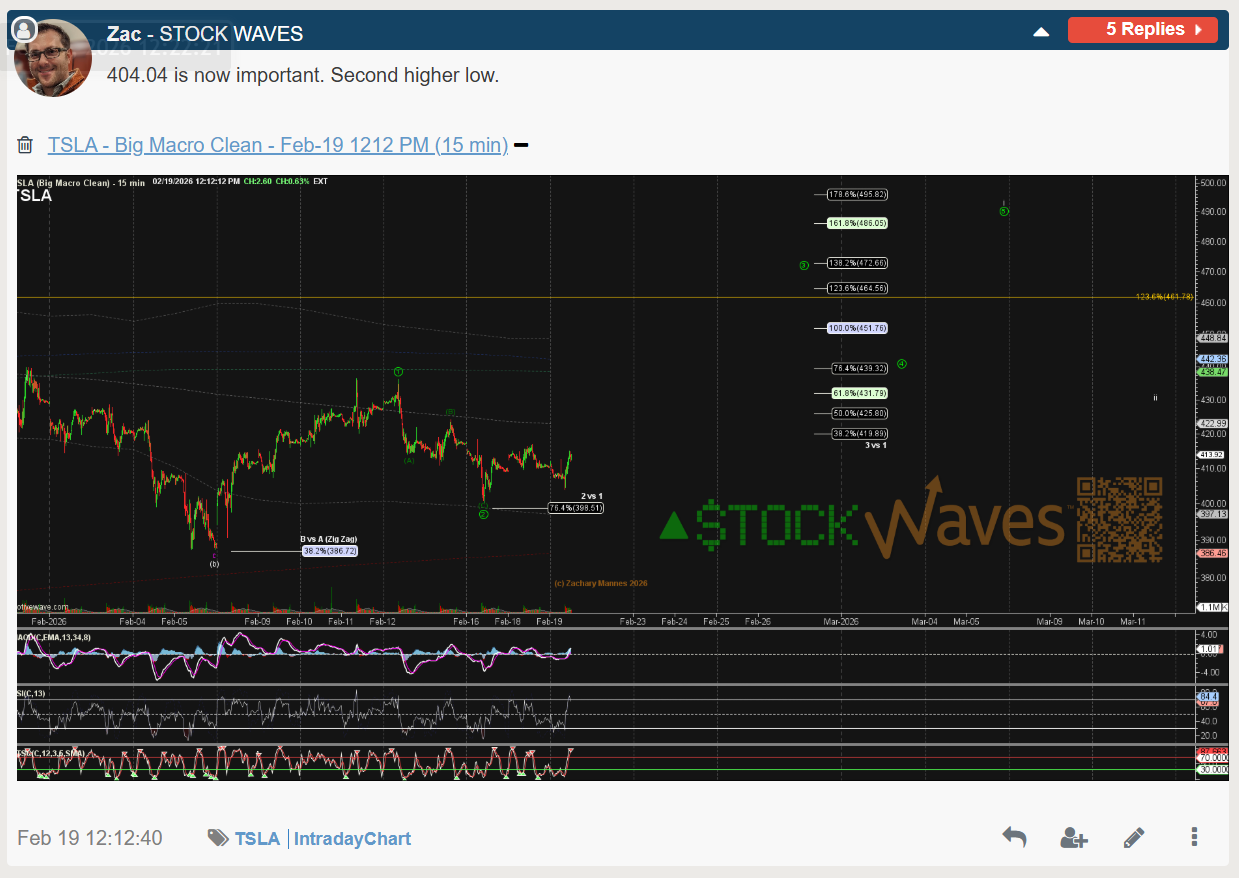
While the count is rarely ever as clean as this picture implies, and the smaller the degree we delve down into the greater the potential for variability, we aren’t afraid to “get into the weeds” to help educate and create understanding for our subscribers.
We continue to track TSLA for our subscribers providing near term support and resistance levels and larger picture support and targets through our Wave Setups. Come and check out how we use Elliott Wave and Fibonacci price levels to provide clear support, resistance and target ranges to effectively measure sentiment on all charts, not just those that are “fundamental free.”
Disclosure: I/We are long TSLA and will follow the Wave Setup parameters shared with subscribers.
