Temporary Climax Bottom Ahead?
 By
By
From last weekend’s update:
Price action is bearish short term, bearish medium term and neutral long term. It was a weak week on the whole.. with the market facing supply and selling off whenever it tested the 4470 area. Short term internal indicators all remain on sell signals.. medium term is holding on to a buy - barely.. and long term remains on sell. Odds is holding on to a buy signal so my view is that we get a bounce/rally very soon into the 4470 area and if exceeded we are likely to test 4520 next. This view is valid as long as we can hold above the 4350/20 area… I do not have much of a forecast to provide beyond the short term at the moment - price action does look bearish bigger picture and bulls have a lot of work to do to change that both on price as well as internals..
What actually happened:
After starting the week in a promising way, market fell apart in the last 2 days on sustained selling and ended at the lows.
Summary/What next for this week?
Price action is bearish short term, bearish medium term and neutral to bearish long term. There was sustained selling in the latter half of the week with price testing toward the 4250 area. Internals all joined the sell side… however, there were some signs of panic selling on Friday. If we get a little more of this on Monday, it is possible for us to put in a temporary climax bottom. $PCSP the overall put call ratio of SPX components hit 0.89 on Friday. The last time we closed this high was on 1/21 and 1/24 of this year. I am waiting for NAAIM numbers to come out this week but I suspect we will have a buy signal there also with sentiment likely taking a nose dive on price action last week. On price, I am watching the 4200/4180 area for buying support to come into the market… if that number does not hold, I think we need to entertain lower lows below 4000 sooner rather than later… but if it holds, we can begin atleast a temporary bounce higher.
Pivots/Zones:
ES Grey Zone areas - The grey zones on the ES 5 min chart below are what I draw in on a discretionary basis - they are supports and resistance areas which the market is most likely to react from. If we test a zone from below, it is likely to be rejected and fall lower to test support zones below. If we test a zone from above, it is likely to take support there and begin a move higher. So these zones can be used for intraday trading and/or as entry points for positioning for swing trades. These zones are drawn in based on what the market has done there previously both on smaller and larger timeframes.
Grey zone resistance at 4310-22 and then 4355-66. Support is at 4247-33 and then 4190-76.
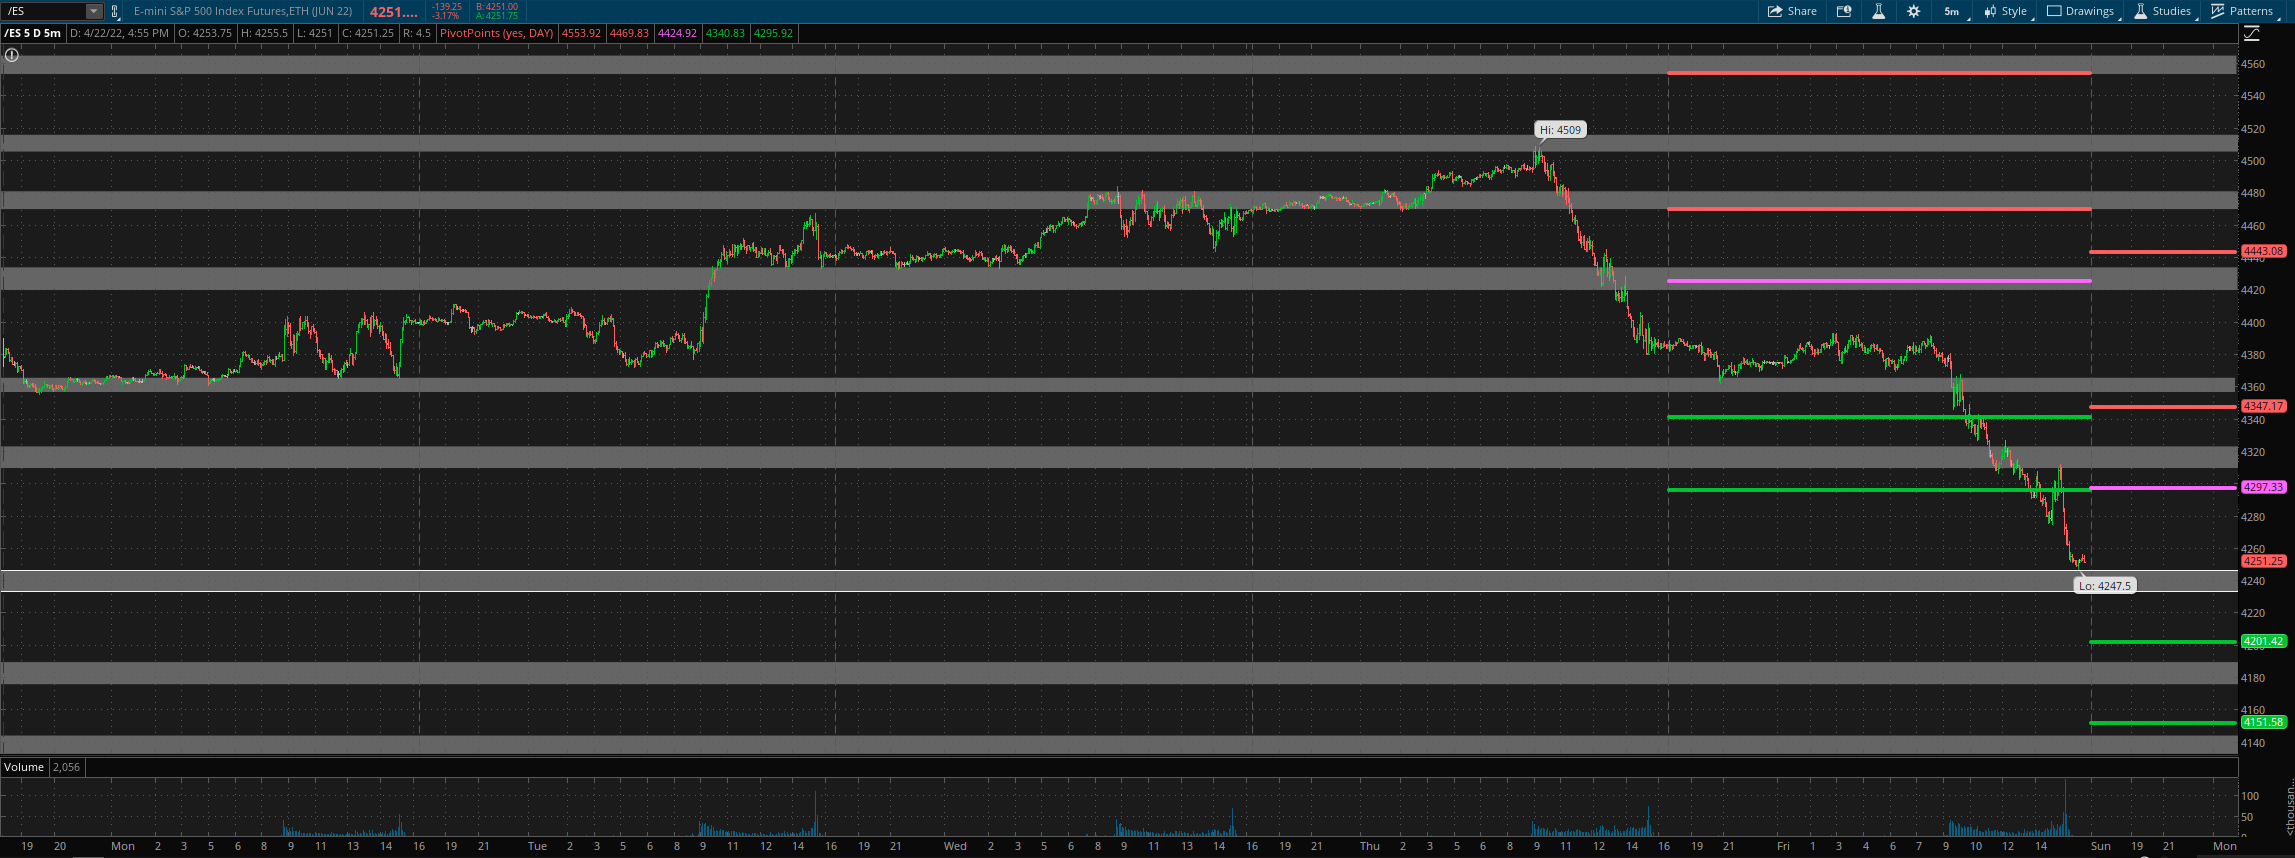
For Monday, daily pivot is at 4297.5. Resistance R1 is at 4347 and R2 at 4443. Support S1 is at 4201.5 and S2 at 4151.5.
All the best to your trading week ahead.
