Technical Update on CEQP, PTY, DFP, DMB, RQI, and UTG
 By
Jason Appel
By
Jason Appel
StockWaves / High-Dividend Investing Elliott Wave Update
Technical Update on CEQP, PTY, DFP, DMB, RQI, and UTG
This series of articles is intended to provide Elliott Wave and Fibonacci Pinball Analysis as an accompaniment to Rida Morwa’s High Dividend Investing (HDI) Service. Our goal is to provide greater context as to where price is within the trend for the opportunities being presented by Rida Morwa’s group. This will include support regions for potential entries and target regions for the bigger trend and some commentary on the quality of the Elliott Wave pattern.
In this new format, we will focus on just the Elliott Wave patterns of the tickers from recent HDI updates. This technical update pertains to Will Barton’s July 30th Article: Weekly Picks: Building Your Income With Funds
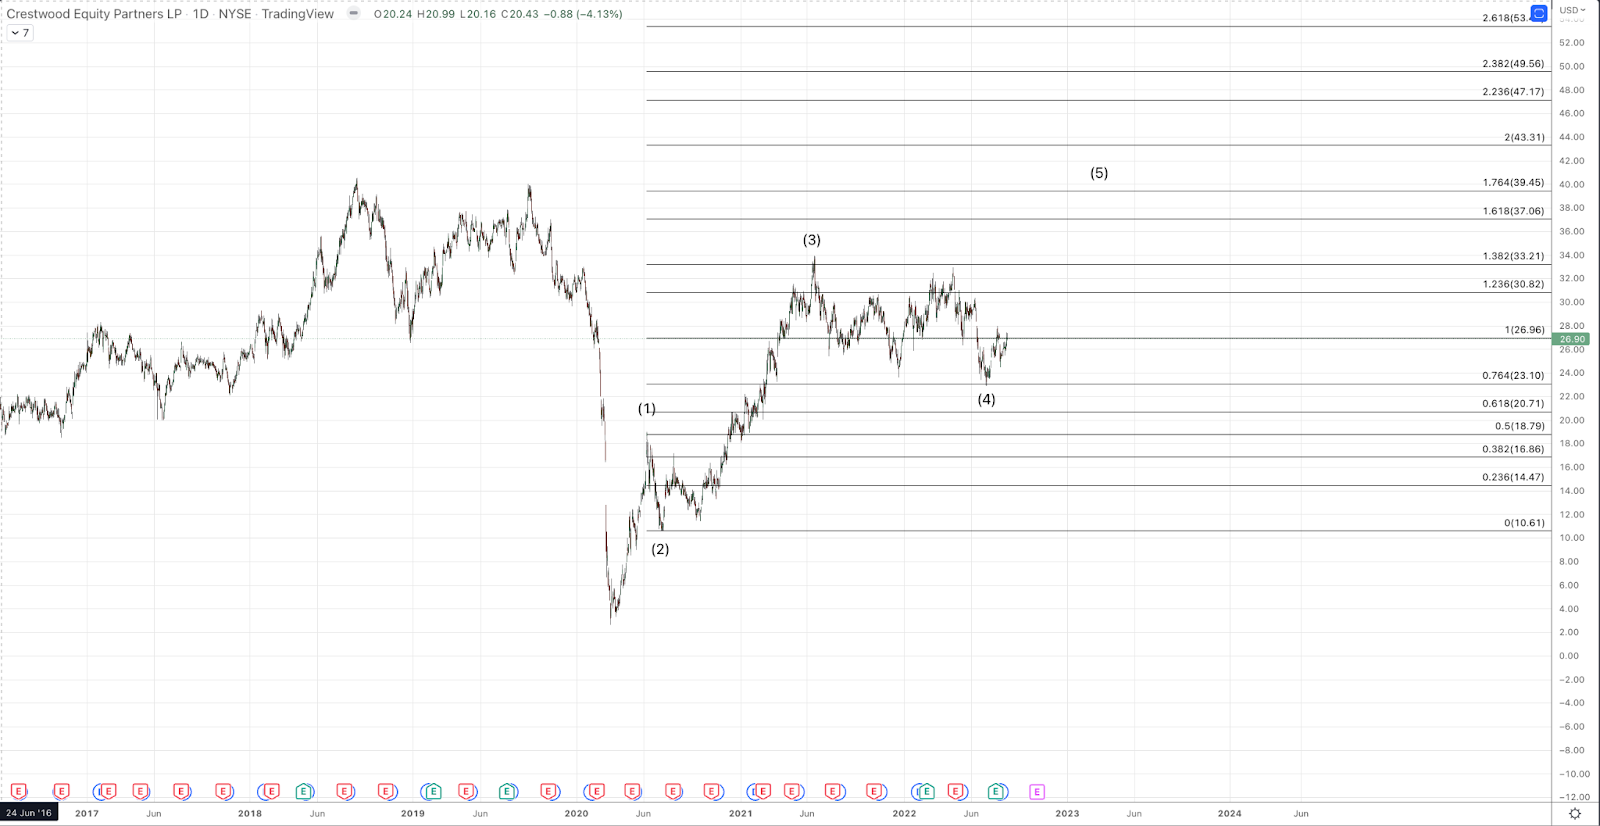
CEQP - Crestwood Equity Partners - 9.71%
Highlights: CEQP owns and operates midstream assets centered around gathering, processing, treating, compression, storage, transportation and marketing of Natural Gas, Natural Gas Liquids, and Crude oil. “The partnership maintains a strong balance sheet with a pro forma leverage ratio of 3.8x in Q1 2022. CEQP projects leverage below 3.5x in 2023 once the recently acquired assets are fully integrated and operations are synergized. CEQP is immune to commodity price fluctuations through its solid base of fixed-fee contracts. The partnership has been expanding through several acquisitions over the past year. This provides long-term benefits to common unitholders, but there is something else we find more attractive.”
CEQP has a potential impulse forming from the 2020 lows. So far, there are 3 waves up with a 5-3-5 structure that has reached the 1.382 Fibonacci extension of the initial wave (1), at the 2021 high. Price has consolidated in wave (4) flat over the past 12+ months into the July 2022 low. From the low struck on July 6th 2022 at $22.88, price has formed a micro 5 wave rally, indicating a likely completion to wave (4) and the start of (5). So long as price remains above the July low, expectations are for price to rally up to $40+ over the next 1-2 years. Ideally, price remains above the August 2022 low, $24.46.
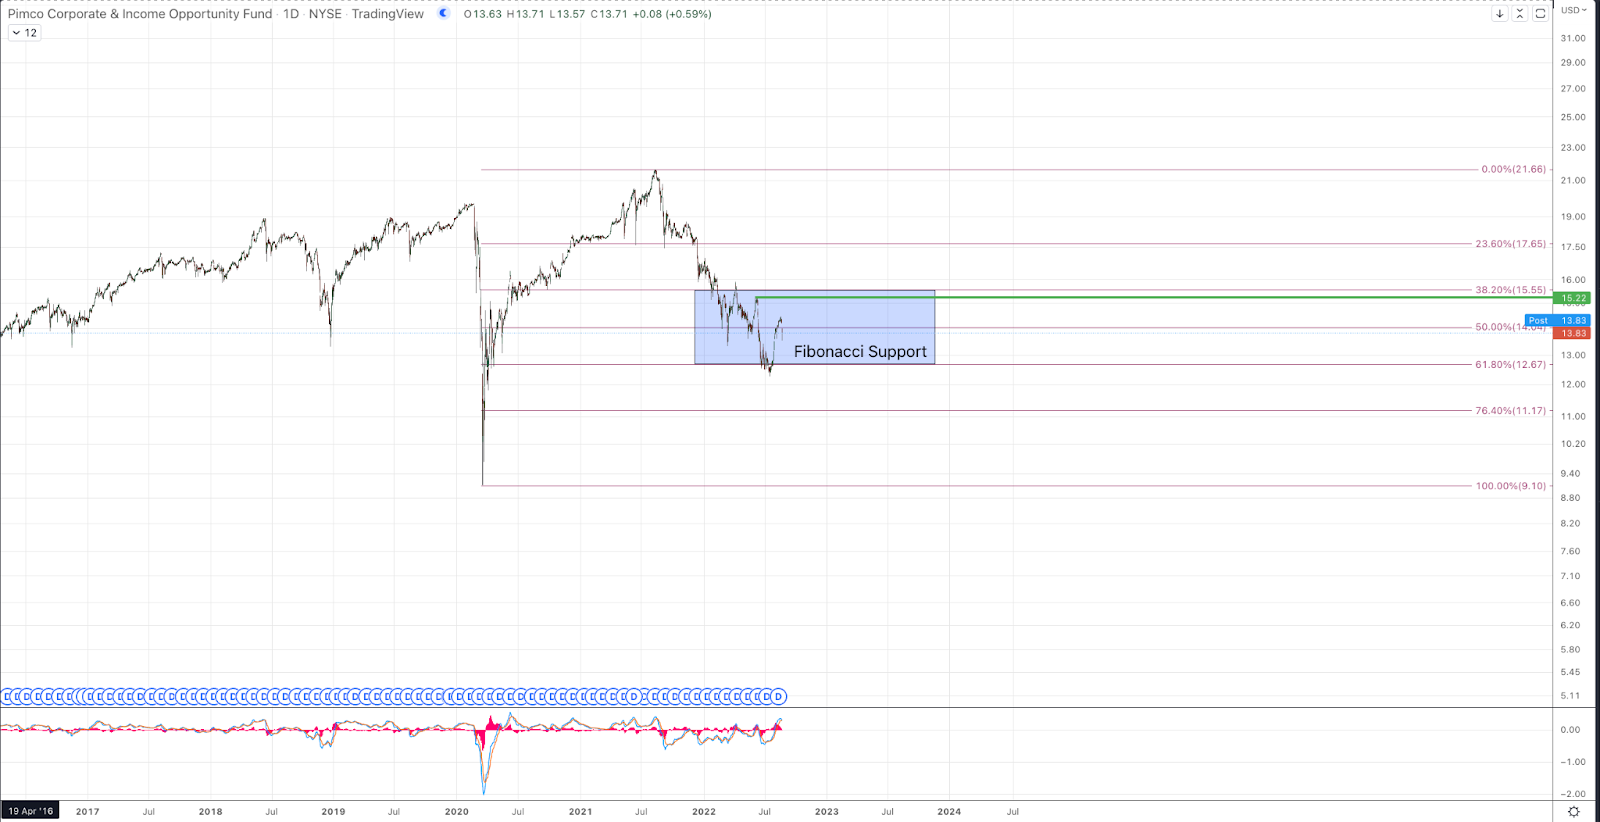
PTY - Pimco Corporate & Income Opportunity Fund - Yield 10.31%
Highlights: In January, PTY generated NII (Net Investment Income) for the month that exceeded the distribution it paid in January by just 3 cents per share. In June (the latest month reported), the NII exceeded the distribution paid out by 7 cents. This increase in income was such that the distribution coverage for the previous 6 months went from 114% to 138%. So, despite being in a period that many think is bad for bonds, PTY increased the safety of its distribution.
PTY formed a substantial rally from the 2020 low into the August 2021 highs, appreciating in excess of 138%. That said, there’s no clear wave count to the move, and the overall structure is ambiguous. At this point, price has retraced down to the 61.8% Fibonacci retrace at the July low. From that low is a potential micro impulse, but the scale is a bit too small to be reliable. So long as price remains above the July low, there is a viable setup for higher but over $15.22 is needed to more confidently favor a low in place. Given the lack of clarity, we are without any reliable upside targets here.
Labels are on the chart as placeholders; they should not be taken as confident projections
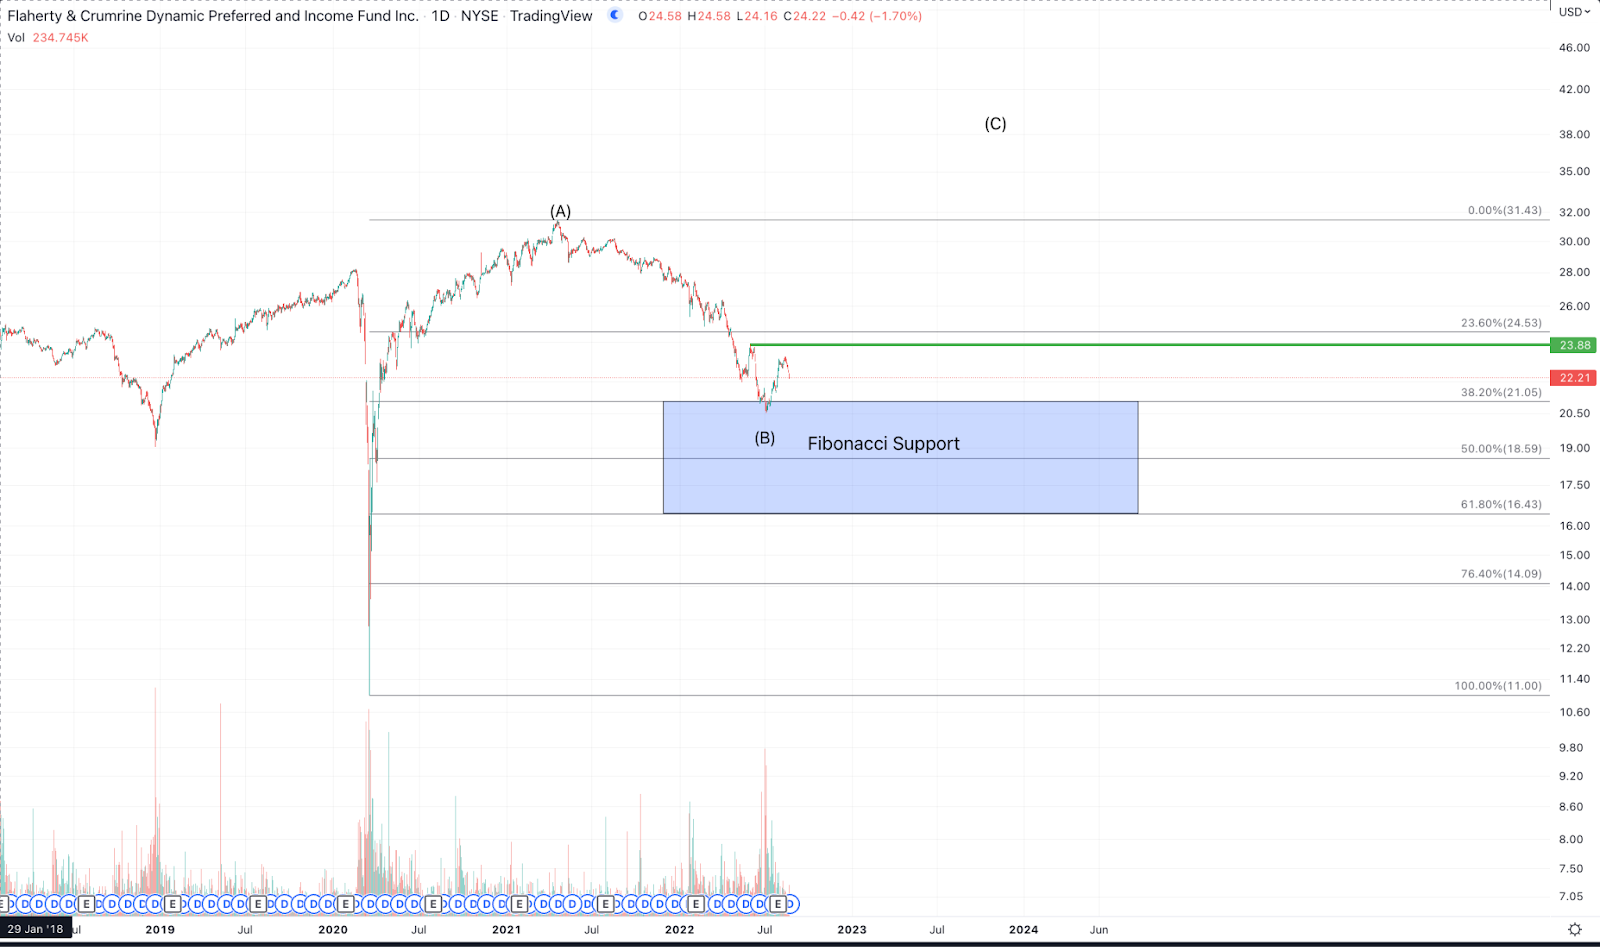
DFP - Flaherty & Crumrine Dynamic Preferred and Income Fund - Yield 7.02%
“Right now, the fear of the impact of higher interest rates is having an outsized impact on the price of preferreds and funds like DFP that invest in them. This makes for a very good opportunity to pick up a fairly safe investment with a healthy yield. Even with the announcement on July 21, projecting the most recent distribution for a year gives a forward yield of 6.9%, about the 5-year average. With about 45% of its portfolio in investment-grade securities (and another 40%+ in companies with investment-grade ratings), the 90% fixed-to-float nature of the holdings makes this a good buy for income in uncertain times.”
DFP rallied 185% from the March 2020 low into the April 2021 high. The rally is not a clear 5 waves so there is no confident indication the continuation higher is likely. So far, price has pulled back to the 38.2% Fibonacci retrace of the entire rally and is without any clear indication of a lasting bottom struck. Minimally, a 5 wave rally exceeding $23.90 is needed to provide some reliable signal of a bottom in hindsight. Until then, price can drift lower and Fibonacci support ranges down to $16.43. Labels are on the chart as placeholders; they should not be taken as confident projections.
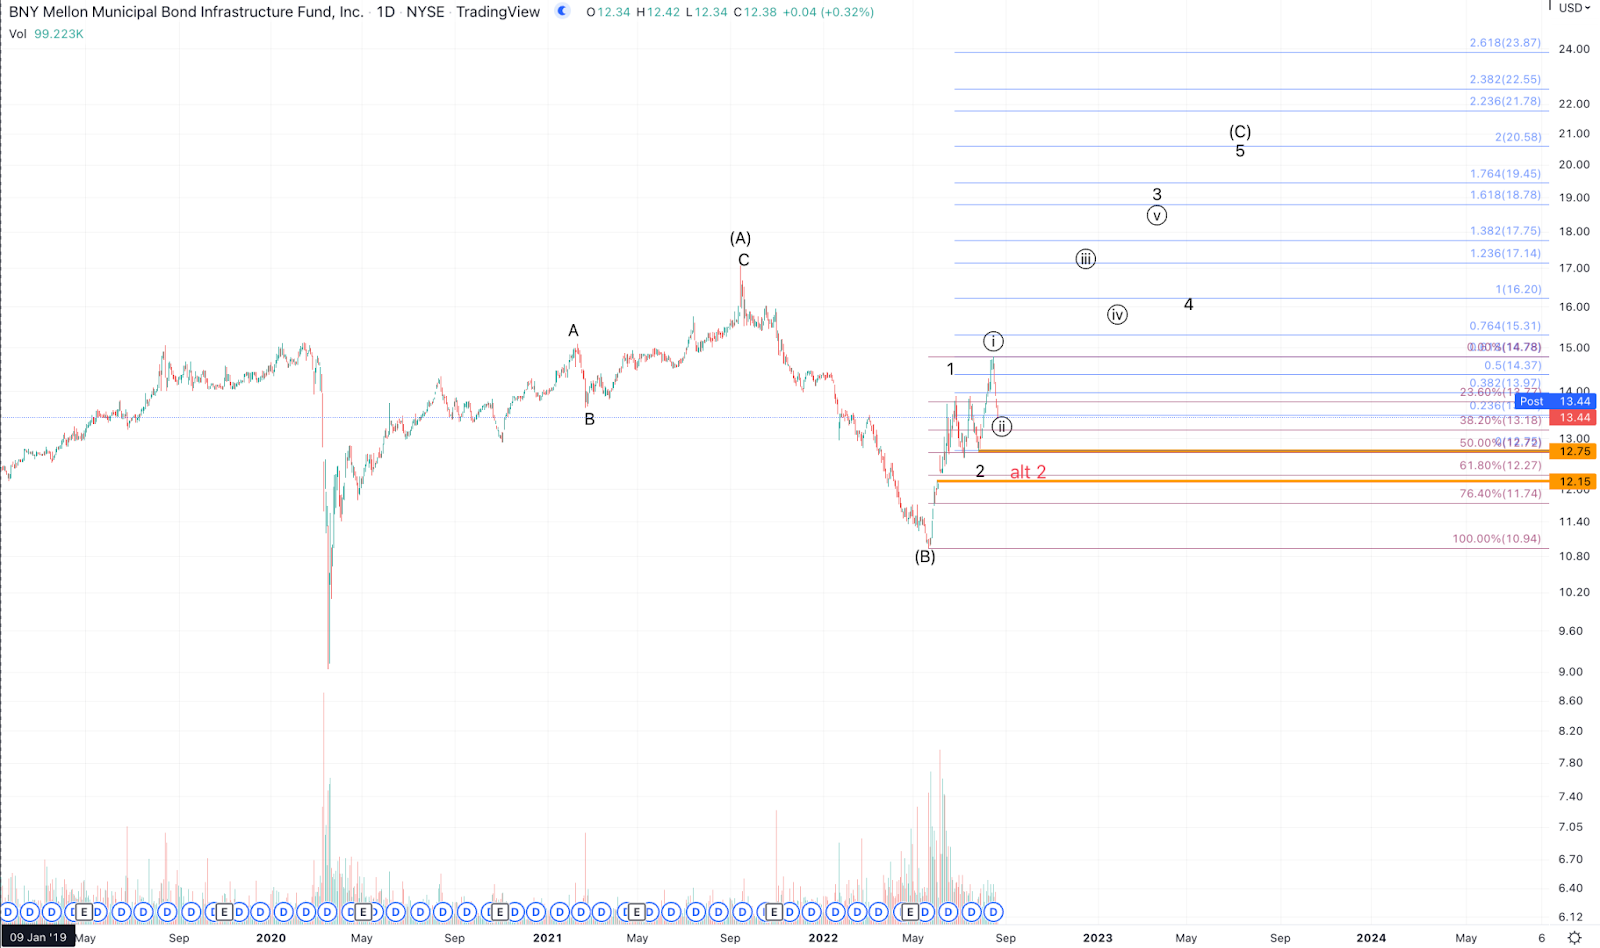
DMB - BNY Mellon Municipal Bond Infrastructure Fund - Yield 4.73%
“With prices beaten down by inflation and rate hike fears, now is the time to buy municipal bonds. While both inflation and interest rate hikes represent real headwinds for municipal bonds, the market has done what it can always be counted on doing. It has over-reacted to an extent that has made municipal bond funds a good value. As income investors, now is the time to pick up a safe stream of income at a good price.”
DMB has what counts best as a 3 wave rally from the March 2020 low to the September 2021 high. Price appreciated 98% in that span. Though price has retraced steeply from that high into the May 2022 low, DMB rallied in 5 waves, indicating heightened likelihood of upside followthrough. The most bullish and favored interpretation is that DMB now has a possible 1-2, i-ii setup forming to propel price much higher upon completion of ii. This interpretation is valid so long as price remains above $12.75, but ideally, DMB should remain over $13.20 and commence a strong rally targeting $17+ for wave iii of 3. Below $12.75 would allow for a bigger 1-2 that should remain above $12.15 in order to maintain a bullish outlook.
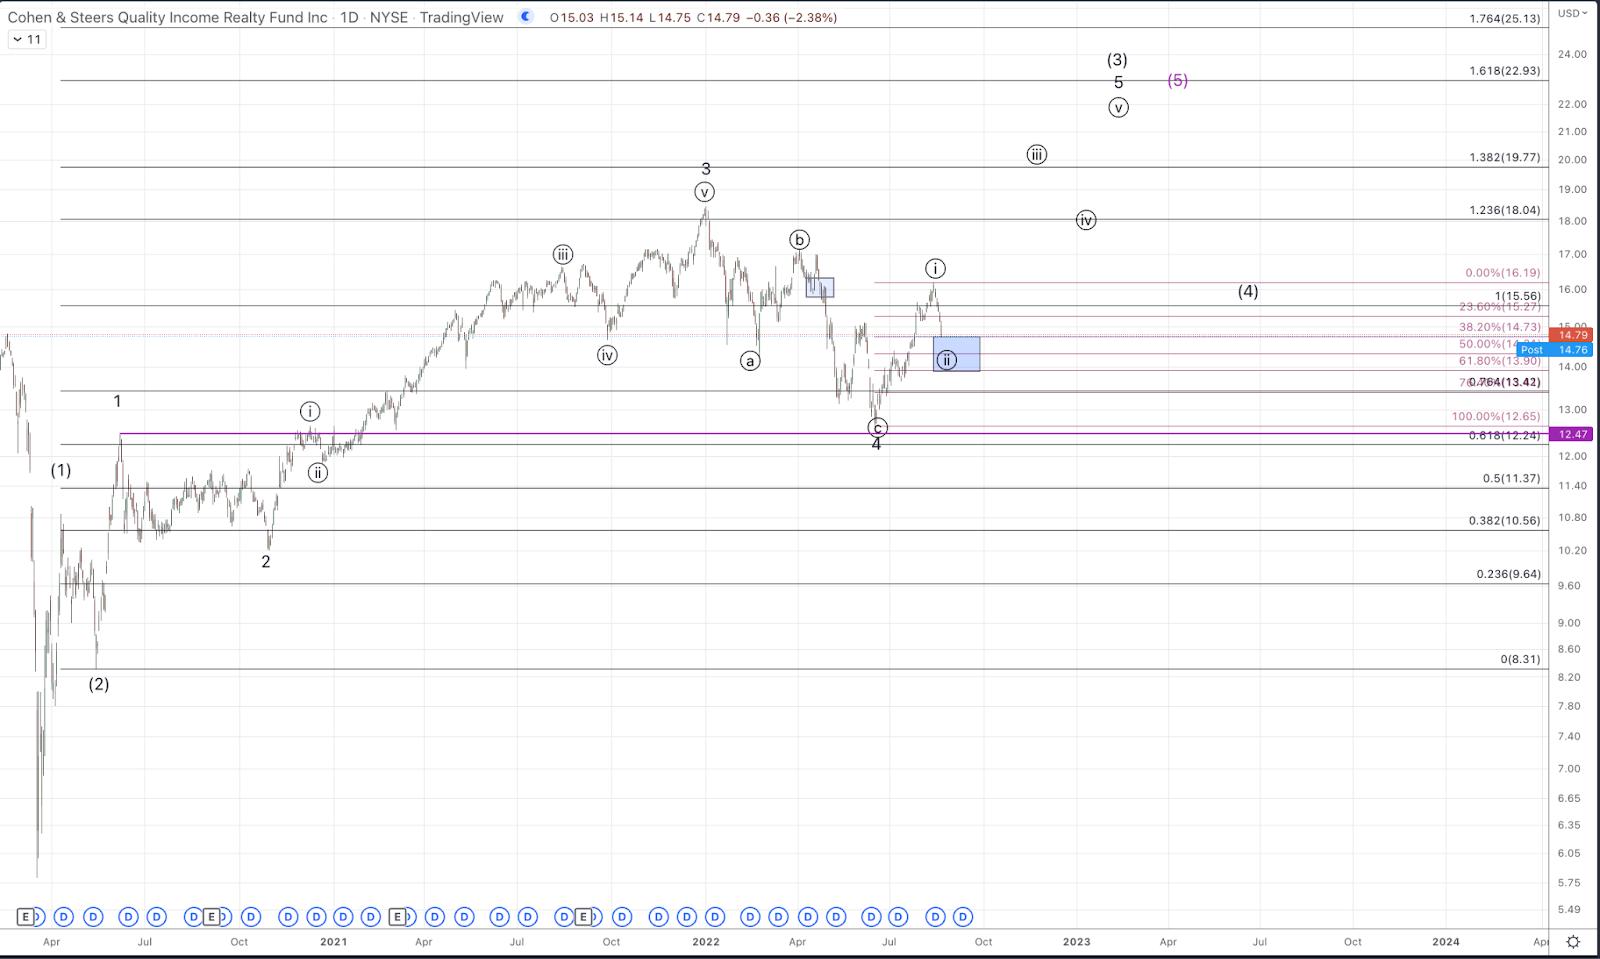
RQI - Cohen & Steers Quality Income Realty Fund - Yield 6.49%
“[REITs are] a fairly stable income stream because people and businesses tend to pay their rent even in the hardest of times. When circumstances force them to get behind on some of their expenses, rent is usually the last expense to be skipped.
On top of that, real estate and rent are both inflation-protected. Real estate prices tend to trend upward with inflation as a physical asset. Rent has significant weight in determining inflation. Looking at the latest inflation report, rent (for consumers) saw a 5.5% increase from last year. For businesses, rental contracts frequently rely on inflation measures like CPI to determine rent increases year to year.”
RQI has an impulsive structure off the March 2020 low. The pattern has formed a near perfect Fibonacci Pinball impulse with wave 1 of (3) striking the .618 extension of the (1)-(2) and 3 of (3), topping just above the 1.236 extension at the January 2022 high. From the January high, price has formed a clear a-b-c pullback to the standard support region for 4 of (3) between the .618 and .764 extension into the June low. Since June, price has rallied 28% from the low to the peak in mid-August and has formed a potential 5 up, suggesting a low is in place for 4 and price has resumed the larger uptrend in wave 5 of (3), ideally targeting $22.50+. Fibonacci support for ii of 5 is $13.90-$14.75 and RQI should remain above $12.65 at all times for this interpretation to remain valid.
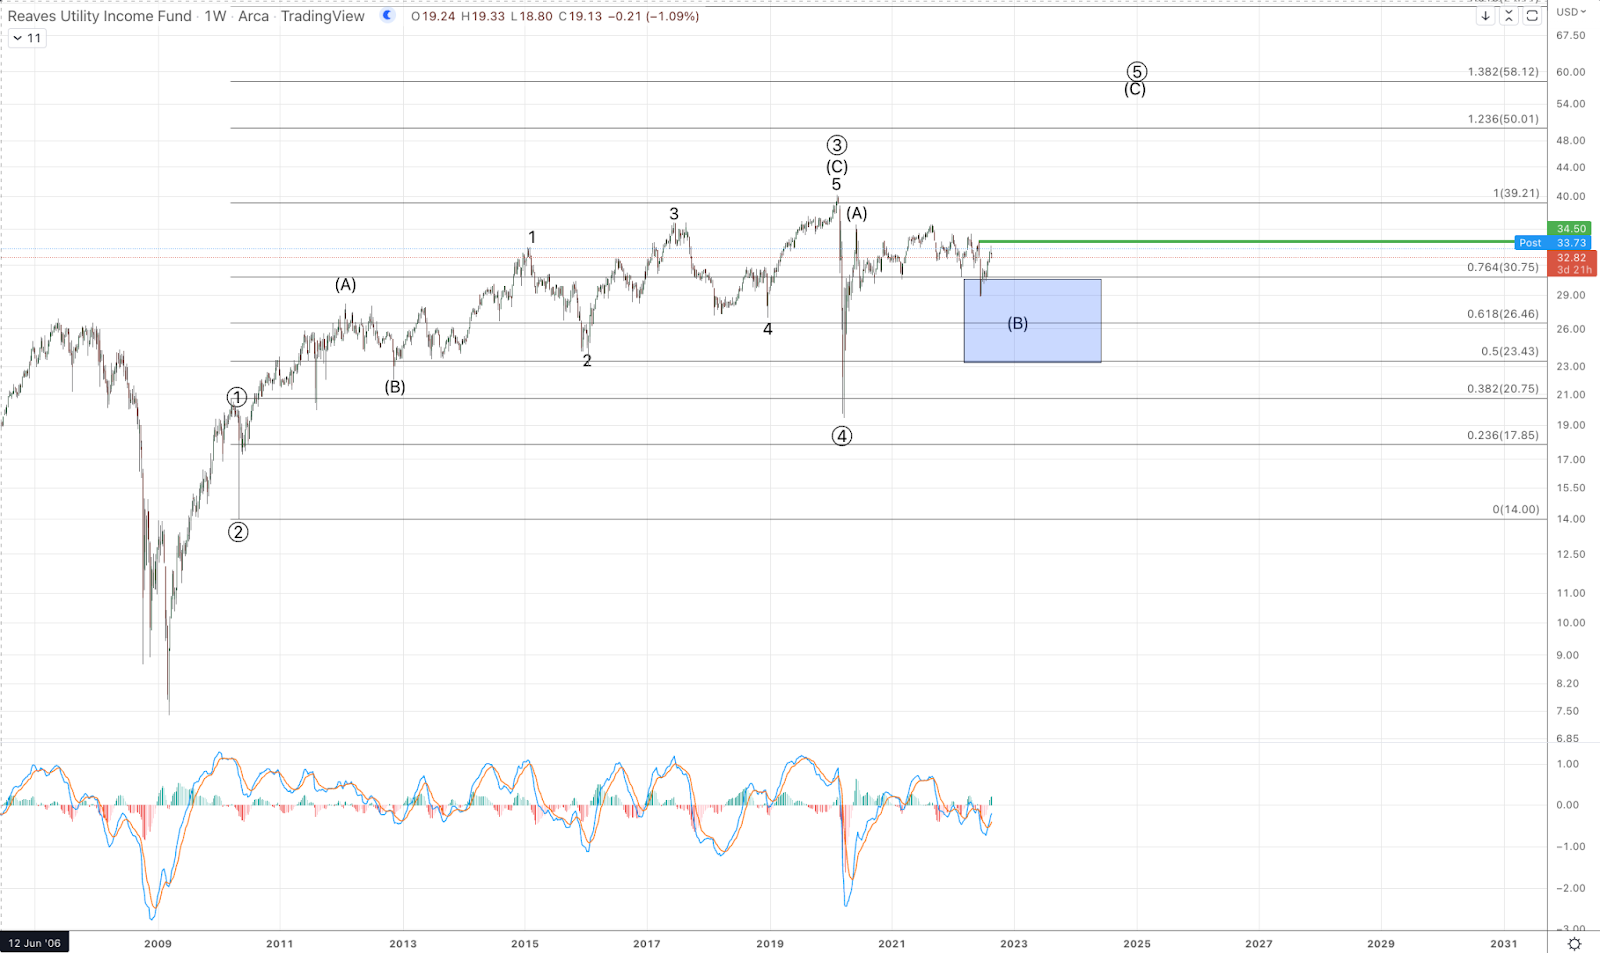
UTG - Reaves Utility Income Fund - Yield 6.95%
“UTG has demonstrated an impressive ~61% increase in NAV, with no distribution cuts since its inception on February 24th, 2004. This distribution record has allowed UTG to produce a highly reliable income for shareholders. The CEF has also paid the occasional special dividend over the years.”
UTG appears to be in the latter stages of a diagonal from the 2009 low. That means UTG is expected to form a 5 wave move, labeled circle 1-2-3-4-5 in which each of the primary waves is composed of a series of 3 wave moves. In the initial ascent from the 2020 low, price rapidly climbed nearly 88% in the (A) of 5 into the June 2020 high. Since then, UTG has consolidated more or less sideways in a (B) wave for the past 2+ years. Currently, there is no indication that (B) has completed. In order to signal a low in place for (B), 5 waves up through $34.50 is needed. Until then, UTG has ample support down to ~$23.50 though it is not expected for price to retrace that deeply. Once an initial 5 waves up forms through noted resistance, we will have an initial signal of price starting wave ( C ) of 5, minimally targeting $50+ but ideally $58+.