Technical Update On Tesla
 By
Jason Appel
By
Jason Appel
TESLA Special Update
There’s really no stock like Tesla (NASDAQ:TSLA) out there. For years, many analysts and traders alike have bet against the auto manufacturer with frustrating results, at best. In 2020, TSLA gained 741.7% on the year and 905% from the March lows, smashing even the most bullish expectations of many permabulls. With such incredible gains in 2020, Tesla overtook Toyota (NYSE:TM) to become the world’s largest automaker by market capitalization. Overall, we see Tesla as a very bullish play long term, but with shorter-term risk increasing rapidly as price approaches resistance.
Fundamentally, TSLA is overvalued, and those who’ve been shorting the stock have been saying this all along. As of January 2021, the price-to-sales ratio is soaring in the upper 20s. A large pullback to temper the sentiment would still be very constructive long term so long as important price support is held.
From a purely technical perspective, on a long timeframe, TSLA looks marvelous.
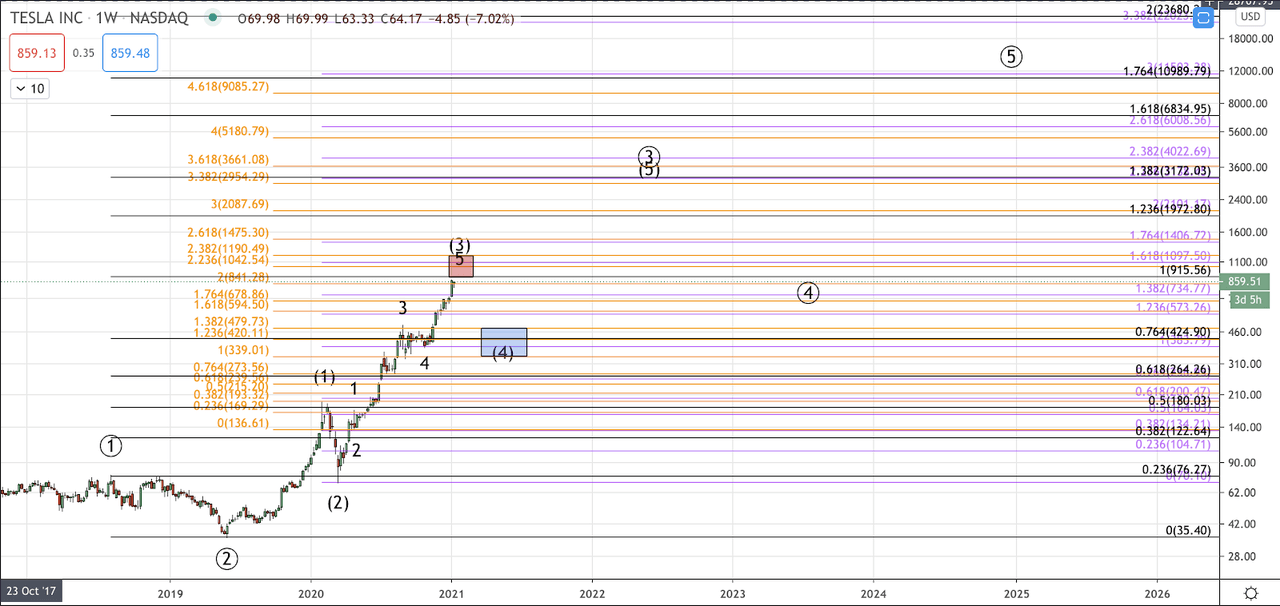
The rally off the post-inception low in July 2010 into the August 2018 high counts nicely as an Elliott Wave impulse in 5 waves. From that high in Summer 2018, price made what is considered in Fibonacci pinball to be a very shallow wave 2 correction, only reaching the .236 retracement of the initial 5-wave move. The .236 retracement at $35.96 provided strong support, and TSLA found a bottom and subsequently launched upward from the June 3, 2019 low at $35.40.
Tesla has continued upward in impulsive fashion, forming an intermediate wave (1) into the February 2020 high and a 3-wave correction into the March 2020 low for wave (2). From that low, TSLA has skyrocketed into the heart of a 3rd wave, which we identify as the strongest portion of a rally.
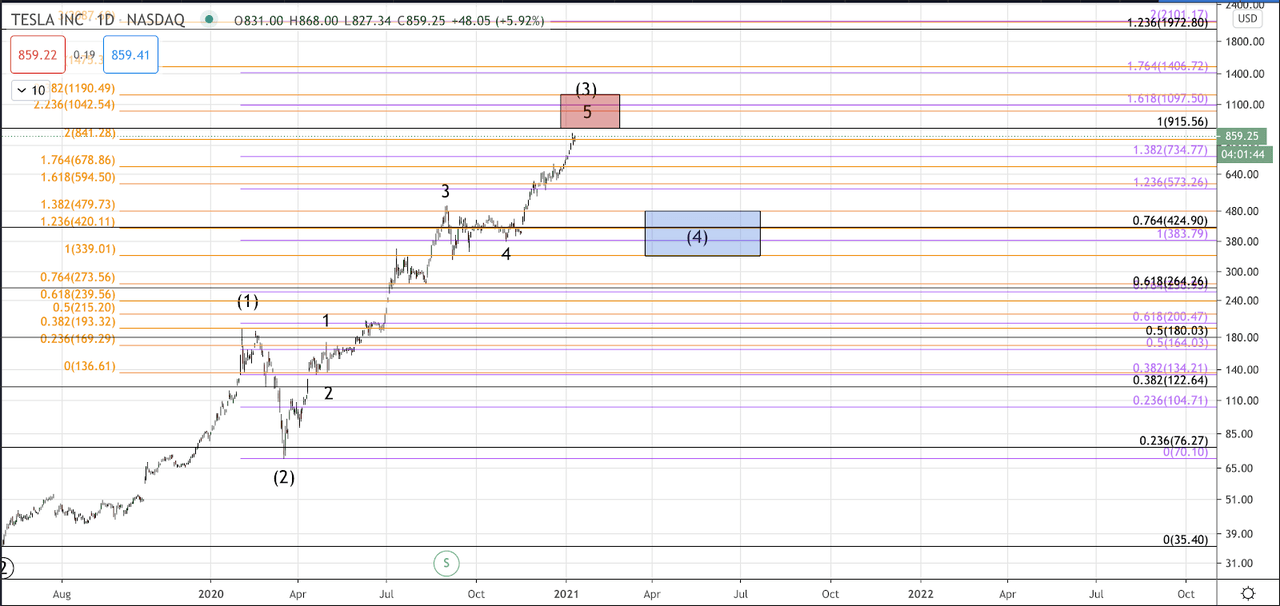
Regarding targets, the wave (1) into the February 2020 high struck the .500 extension (displayed in black Fibonacci lines on the accompanying charts). With such proportions, our expectation for the wave (3) is for price to reach the 1.0 extension (black lines), which is at $915.56. Based on the smaller degree of action and the wild volatility exhibited by TSLA, it’s certainly possible for price to exceed this level, even by a considerable amount. The smaller degree price action shows that TSLA could reach as high as the $1200 level for all of wave (3).
Support for wave (4) ranges between $339-$480. We realize this represents a 40%-plus correction, but considering the epic rally in 2020, the massive volatility, and the rampant speculation on this stock, this appears reasonably probable.
Given the larger degree bullish trend, we’d like to focus on where support exists for possible entries and adding to positions once price does finally make a larger pullback. The noted resistance region above may be a reasonable region to reduce some long-side risk, but TSLA has proved to be a very risky stock to short, and we prefer to trade with the trend rather than against it.
For those who are worried about having missed out: Long term, so long as price remains above $250-$265, $3,172 is the next long-term target, and thus $339-$480, should price get a pullback to this region, represents an outstanding risk/reward entry to trade for the long term target.
TSLA Weekly Chart