TLT in Down Wave of Larger Corrective Bounce
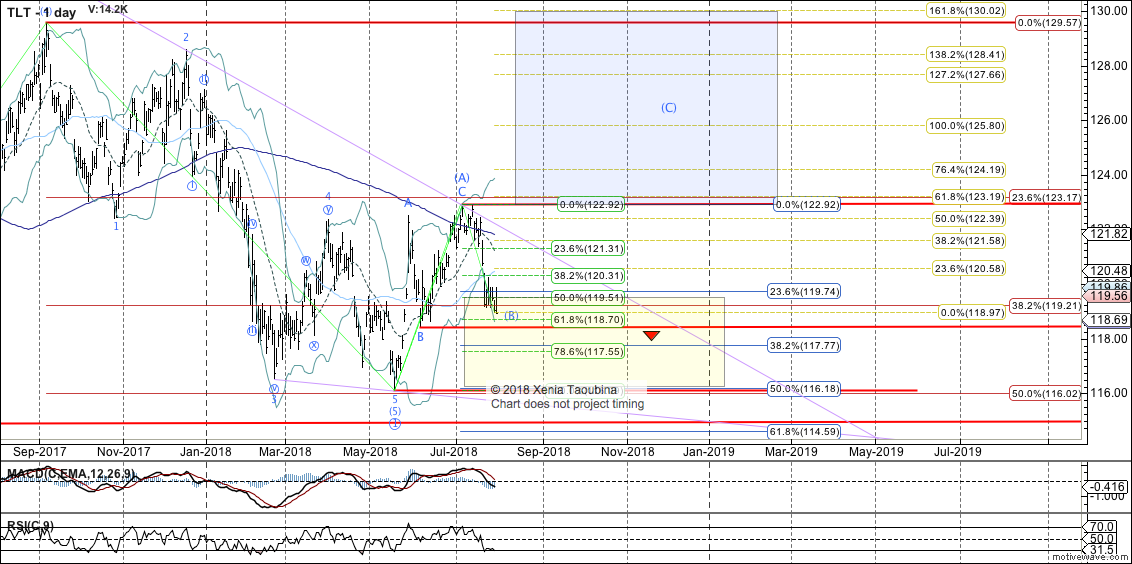
It is now likely that the iShares 20+ Year Treasury Bond ETF (TLT) has completed a three-wave rally off the May low of 116.09. My preference is that it's only wave (A) of a larger corrective bounce after having potentially formed a multi-year top. This bounce should result in a multi-month rally to the 129-133 region, as long as the TLT can now hold the June low 118.42.
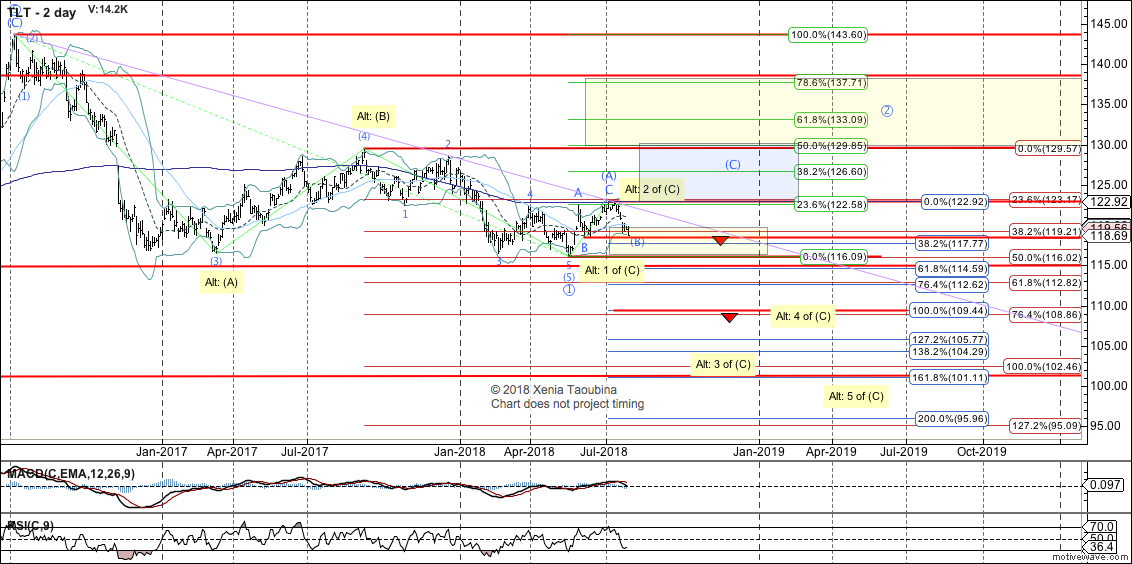
While wave (B) could potentially stage a deep re-test of the May low, for me to favor this scenario I need to see it hold 118.42. IF that level is broken, it will open up the bearish potential on the 2-day chart, and I will have to evaluate the structure of the decline at that time to determine the probabilities of each of these scenarios.
To shift the odds in favor of the bearish alternative count, the TLT needs to break below 114.30, and to confirm this count, it needs to break beneath the blue 1.0 extension on the 2-day chart.
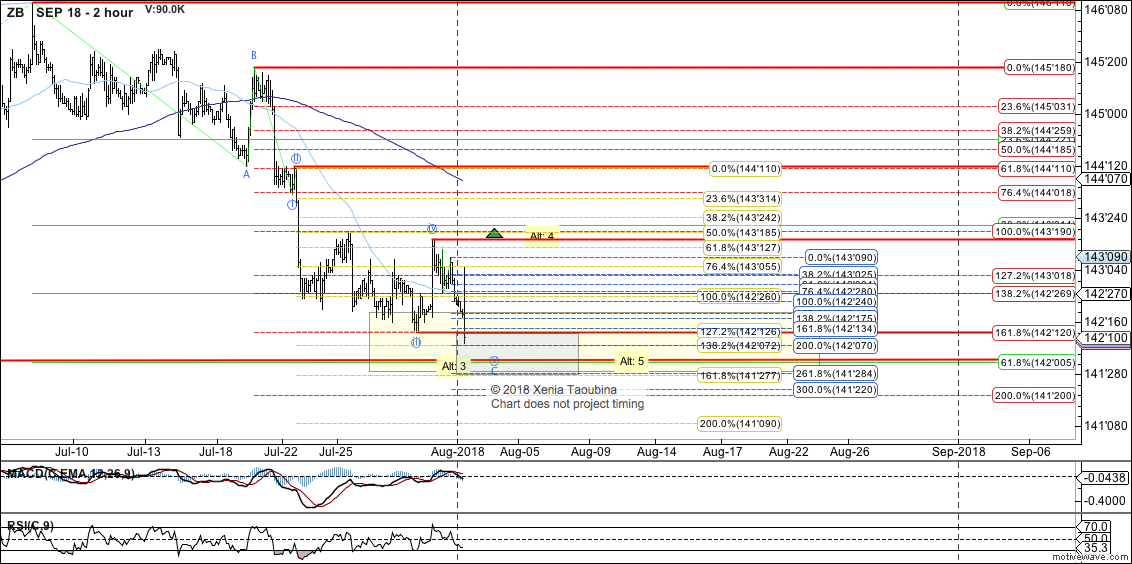
In the 30-Year T-Bond Futures (ZB), we have enough squiggles to consider wave C of (B) complete. A break over 143'19 is needed for initial confirmation of completion. Until then, minor extensions to 142'01 support remain reasonably probable. To open up potential for acceleration lower, ZB needs to get below 141'27.