TLT Could See Substantial Corrective Rally
In the very big picture perspective as shown on its weekly chart, the iShares 20+ Year Treasury Bond ETF (TLT) can be viewed as having potentially formed a multi-year and multi-decade top. To increase the odds of such a lasting top, a corrective bounce followed by a sustained break of the 115 area are needed (labeled in the chart as "primary"). Until we have such confirmation, potential for further highs remains (labeled as "Alt").
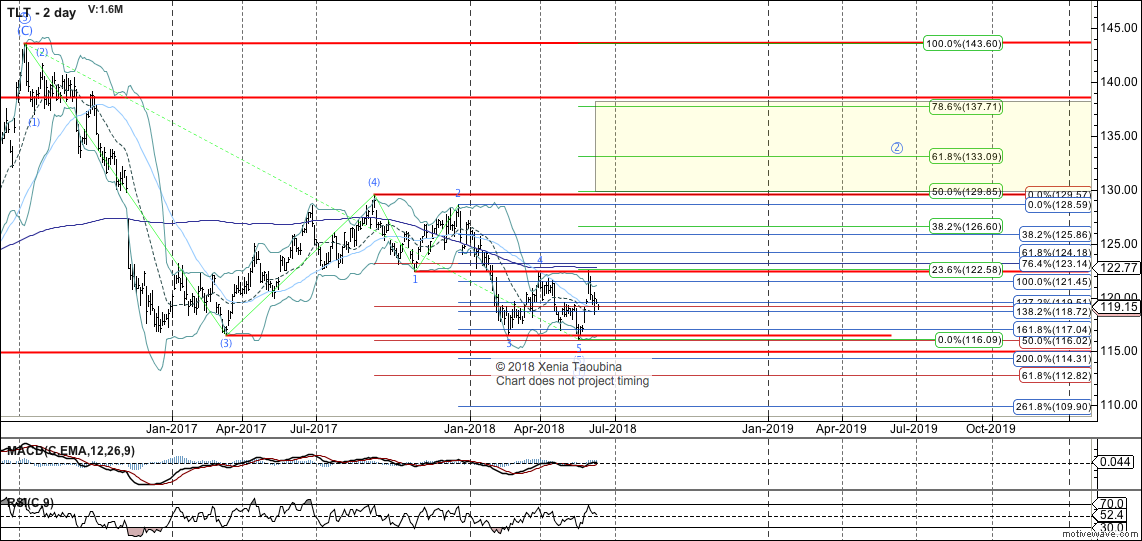
Zooming in on the 2-day chart of the TLT, with a break over 122.43 we now have a fairly good indication that the wave (5) of the impulse off the 2016 high has completed (though an outside chance of moving slightly lower, towards 114.3 support, remains). Our base case expectation now is for a substantial corrective rally, ideally targeting the 129-133 area, with some potential for a rally to a new high.
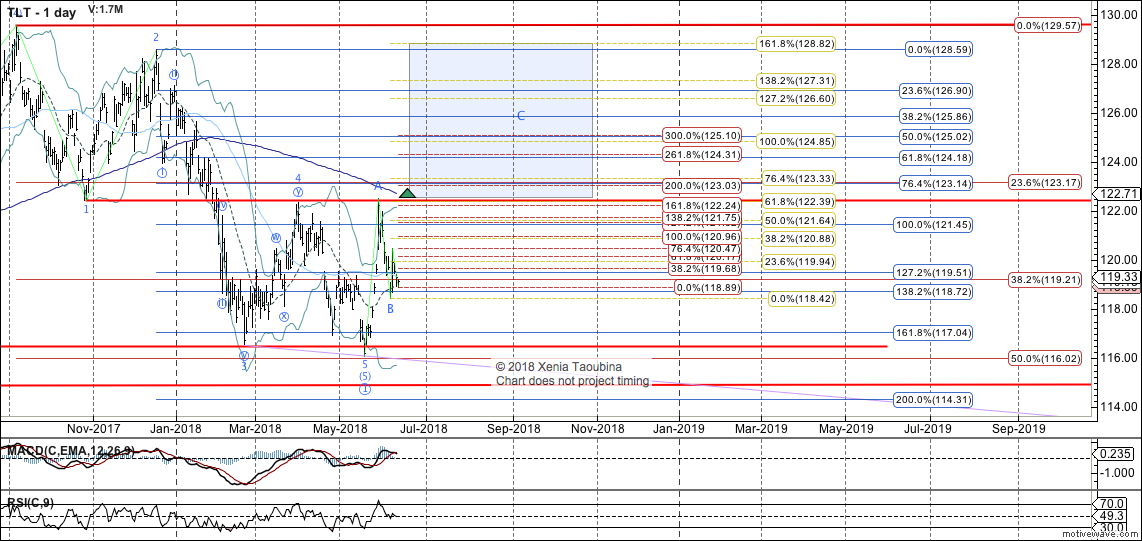
Zooming in further on the 1-day chart, I am viewing TLT as likely in wave B down, having reached 50% retrace. For as long as TLT remains below 122.52, the potential for wave B to subdivide exists. Any break over 122.52 will favor C/3 to have begun, with yellow fibs providing tentative extensions for C/3.
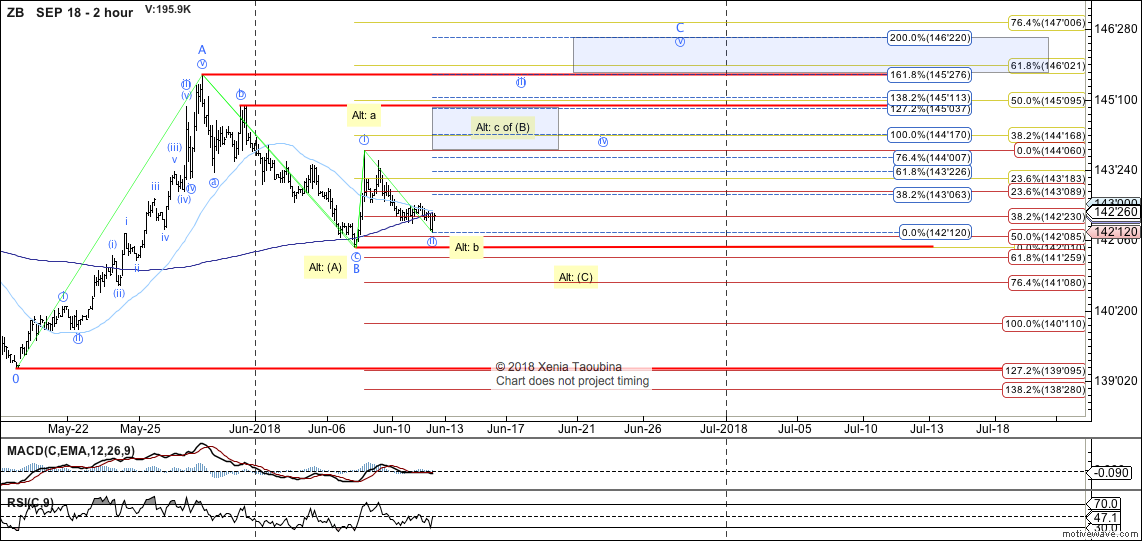
In the 30-Year T-Bond Futures (ZB), a move down off the May high can be viewed as either a three-wave decline (primary count), or a contracting LD down (Alt count). Off the June 7 low, a structure which is best viewed as an impulse developed. So, our expectation is that ZB will hold 142'01, and will stage wave iii/c up. ZB will then need to break over prior high (145'28) to make it likely that B completed. IF ZB is unable to hold over 142'01, it will suggest that the rally off the June 7 low was all of (B), with red fibs relevant extensions for wave (C) down (scenario not labeled).


