TECK: Do Technicals Always Match With Fundamentals?
TECK: Do technicals always match with fundamentals?
Sep 12, 2025
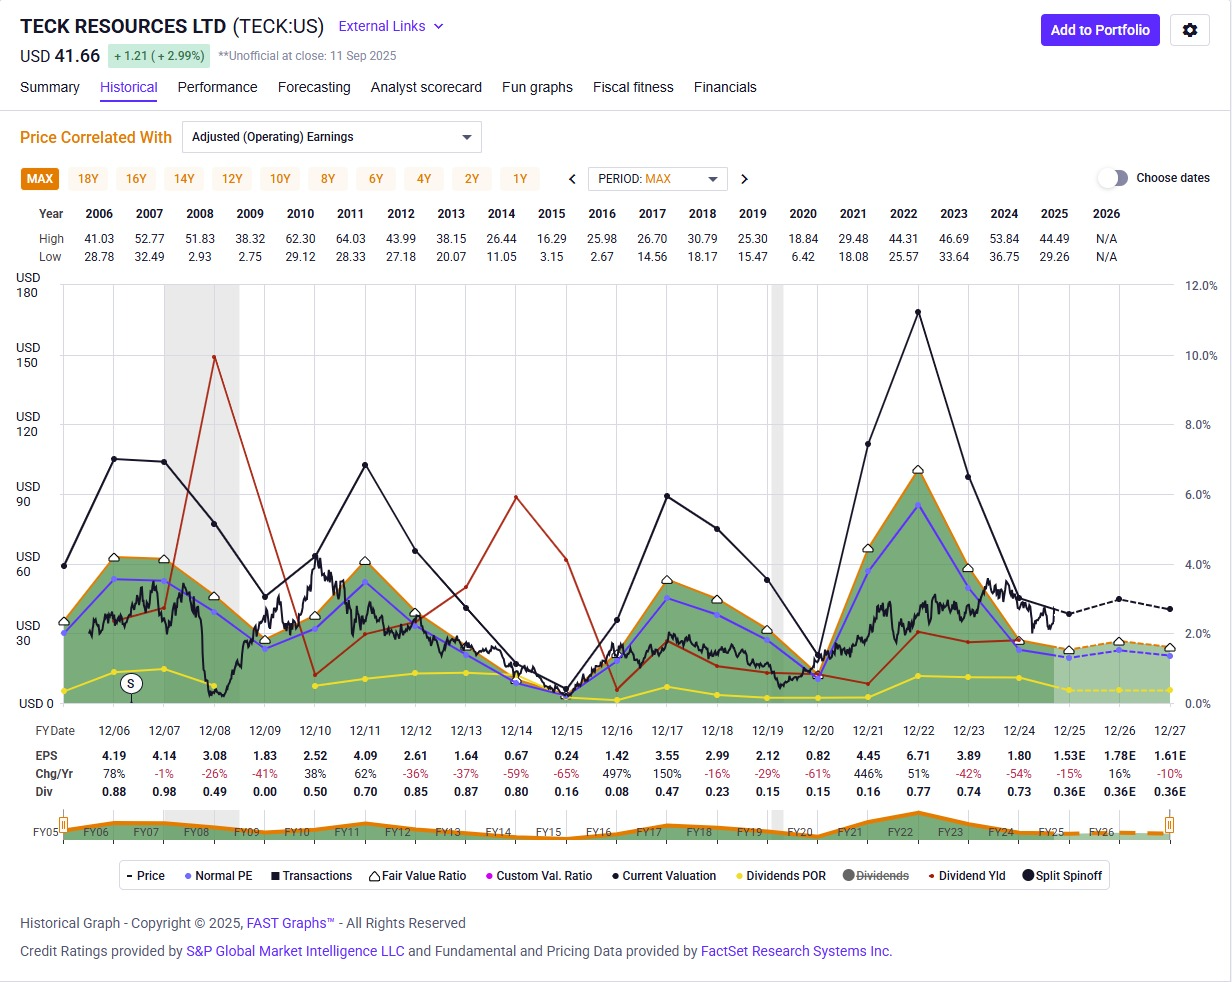
If one looks at the high level values of $TECK as a company, it is clearly being traded at a premium. The company is even going so far to be borrowing or using cash reserves to fund their dividend payouts to shareholders.
PE Ratio: 114
Div Payout Ratio: 116%
The Adjusted Earnings graph tells a similar picture, that while the price of the stock isn’t extremely overvalued, it is definitely not undervalued when looking out over the next couple of years.
While the fundamental parameters make the stock price look overvalued, the technical chart setup was telling a different story.
Several non-precious metals names we track have, just like the indexes, continued to climb with a reliable pullback. $TECK was different and on Sep 9th those who were patient with our Wave Setup saw some action. In late July three analysts flagged the circle a move and corrective retrace into the end of July low as an opportunity and even flagged the potential to reach deeper into support. @ZacMannes on July 25th Metals, Miners and Agriculture (MMA) @ElliottWaveTrdr posted a Wave Setup with a tight RR setup and flagged multiple opportunities to add to the position once 5 waves up and 3 down was indicating the potential circle i-ii start to wave C. While there is the potential for more on the table, we play anything like this one step at a time.
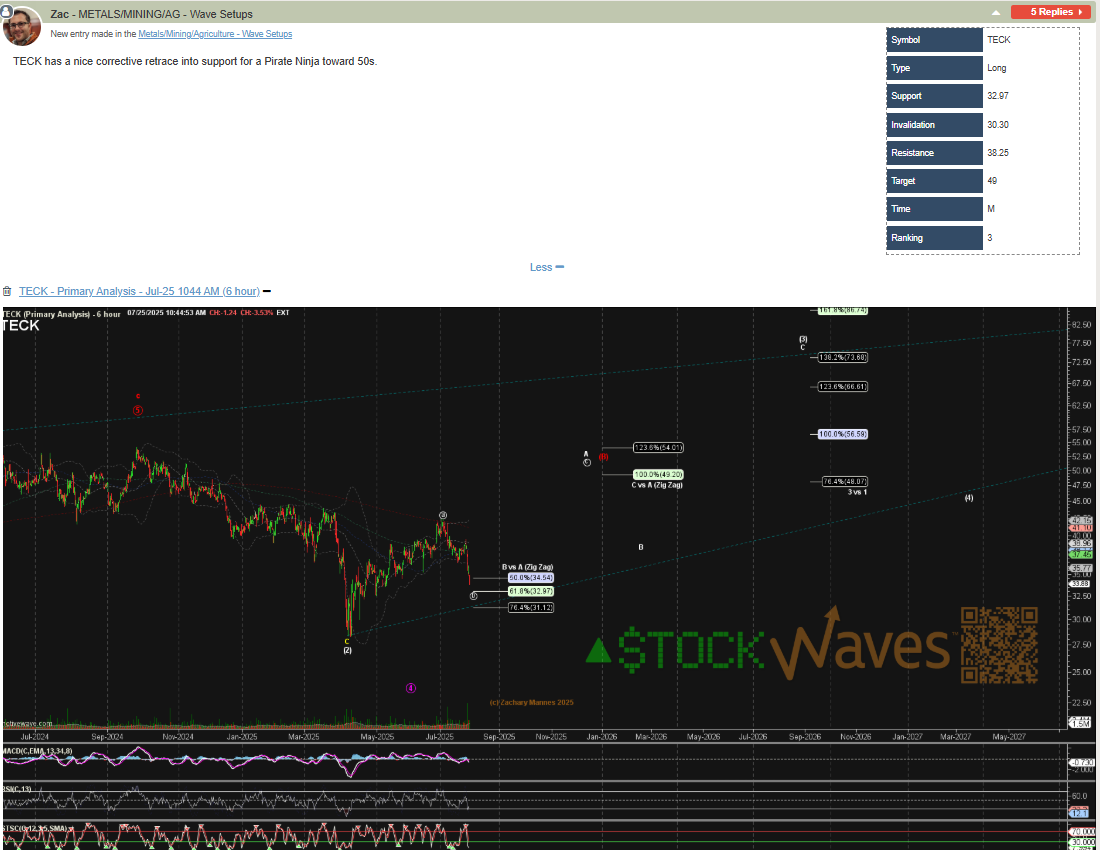
One of the strengths of Elliott Wave Theory is finding symmetrical moves of equal length. In this particular case we are looking for a C = A move on the price scale. This is an Elliott Wave guideline that says a corrective structure can be 100% and 130% of the previous symmetrical structure with a 40 to 70% pullback in between.
Utilizing Elliott Wave Theory and Fibonacci Ratios as a framework, we layer on other technical indicators like MACD and RSI at different time frames to find out if our framework matches what is happening under the surface with buyers and sellers.
In this case we gave initial parameters for support at $32.97 stop out below $30.30, meaning price could get that low without breaking the setup. When initial support was breached, we provided an update for the potential for support lower into the high 30.XXs and maintained a conservative target into the $49 region.
One of our favorite setups is a wave i-ii start to a C wave because the wave iii of C has a strong potential to stretch and outperform with a lower risk level to a stop out below the low. This case was not different, where members were given a chart with the i-ii setup and ideal support levels for that to follow through. This gave Metals Miners and Agriculture (MMA) subscribers multiple opportunities to add to any positions as risk:reward and potential for follow through in the setup improved.
Since the pop on the news catalyst, we have provided updated support levels where members can choose to reduce risk, increase stops to profitable levels and lock in some profits if they so choose.
