Small-Cap Strength Boosts Market Internals
 By
By
As we wrote in last weekend's report: "The Odds indicator is suggesting that we are very close to some kind of top and we have resistance in the 4520 and then 4550 areas. I think one of these turns price lower into the range just below."
What actually happened is that choppy sideways week with price tagging the upper resistance near 4550.
Looking ahead to this week, options data is on the bullish side on review today. Internals are also on the bullish side. Price action is short-term bullish, medium-term bullish and long-term bullish.
Price continued the sideways to slightly higher grind last week. We exited our short trade and entered a partial long trade when the system signaled a change. On the indicators, our Odds indicator stays on the sell side. Internals, on the other hand, improved somewhat on the back of some strength from the small caps. We have resistance in the 4550 area on the Emini S&P 500 (ES). If this is exceeded, then the 4565/70 area is next.
On the downside 4510 is support followed by 4460. The latter needs to be broken to confirm an intermediate-term top. Until that happens, this grind can continue. With internals supporting us, we continue to hold a partial long position.
Grey zone is resistance at 4542-48 and then in the 4565 area. Support is at 4519-11, 4493-86, 4470-61, 4447-39 and then at 4416-08.
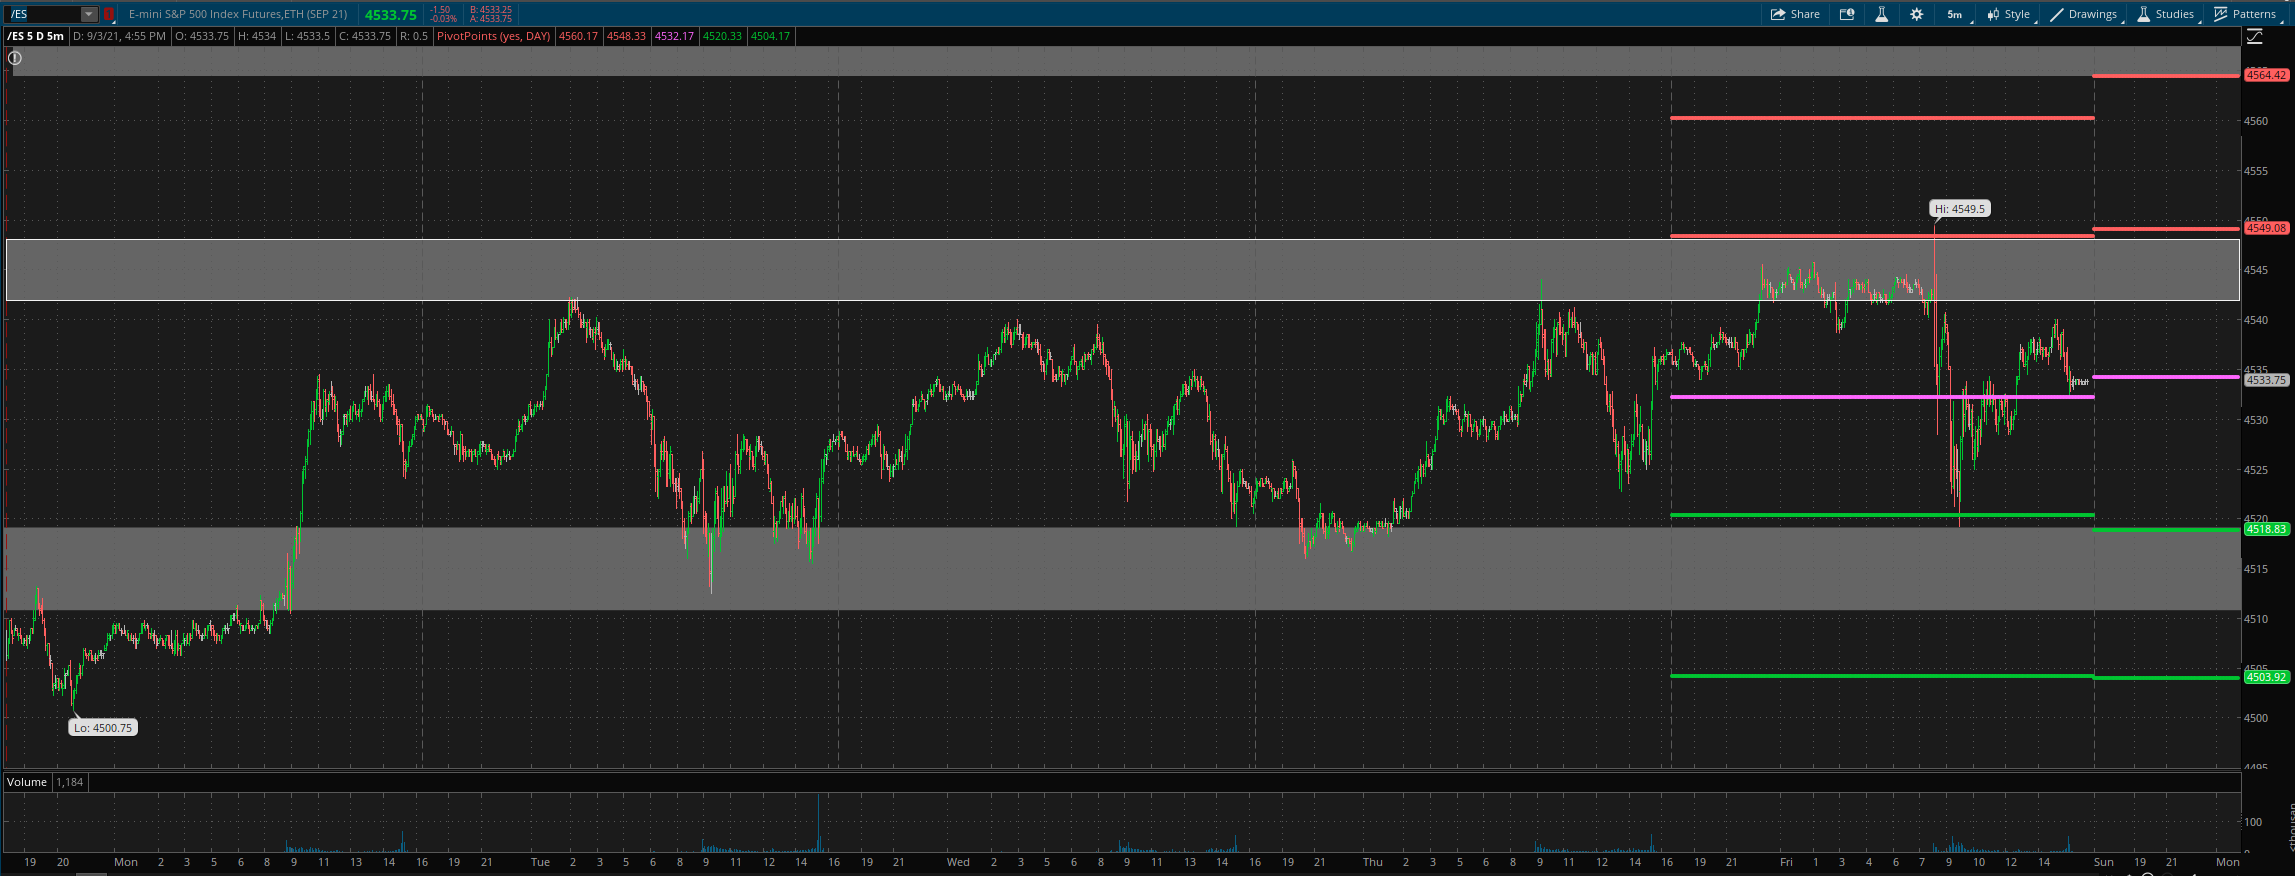
For Tuesday, daily pivot is at 4534. Resistance R1 is at 4549 and R2 at 4564.5. Support S1 is at 4519 and S2 at 4504.
All the best to your trading week ahead.
