Slight Edge to Bears
 By
By
More of our models have been joining the sell side over the last few days. And the Razz models also seem to be pointing to further weakness over the month of October. Price action also seems to be a little more jittery during the day, as in buying support does not seem to be very evident during the day. I suspect this is because there is not much short covering support, but this is just a guess.
Based on everything we track, I think it is reasonable to expect this correction to continue for some more time, but this is likely to just be another pause to refresh before we can move back higher. On the upside, 2987-92 is resistance -- if this level can be cleared in coming days, odds increase that correction is over. On the downside, 2954-46 is support and this needs to be broken for next leg down.
On the whole, both bull and bear sides appear to be more or less evenly balanced at the moment with maybe a slight edge to the bears. Regardless, we will continue to use the micro versions of the NYHL1M model to guide us in our trading.
ES Grey Zone areas: The grey zones on the ES 5 min chart below are what I draw in on a discretionary basis. They are supports and resistance areas which the market is most likely to react from. If we test a zone from below, it is likely to be rejected and fall lower to test support zones below. If we test a zone from above, it is likely to take support there and begin a move higher. So these zones can be used for intraday trading and/or as entry points for positioning for swing trades. These zones are drawn in based on what the market has done there previously both on smaller and larger timeframes.
Grey zone support now at 2954-46 and then 2928-2922. Resistance zones at 2974-79 and then higher we have 2986-92.
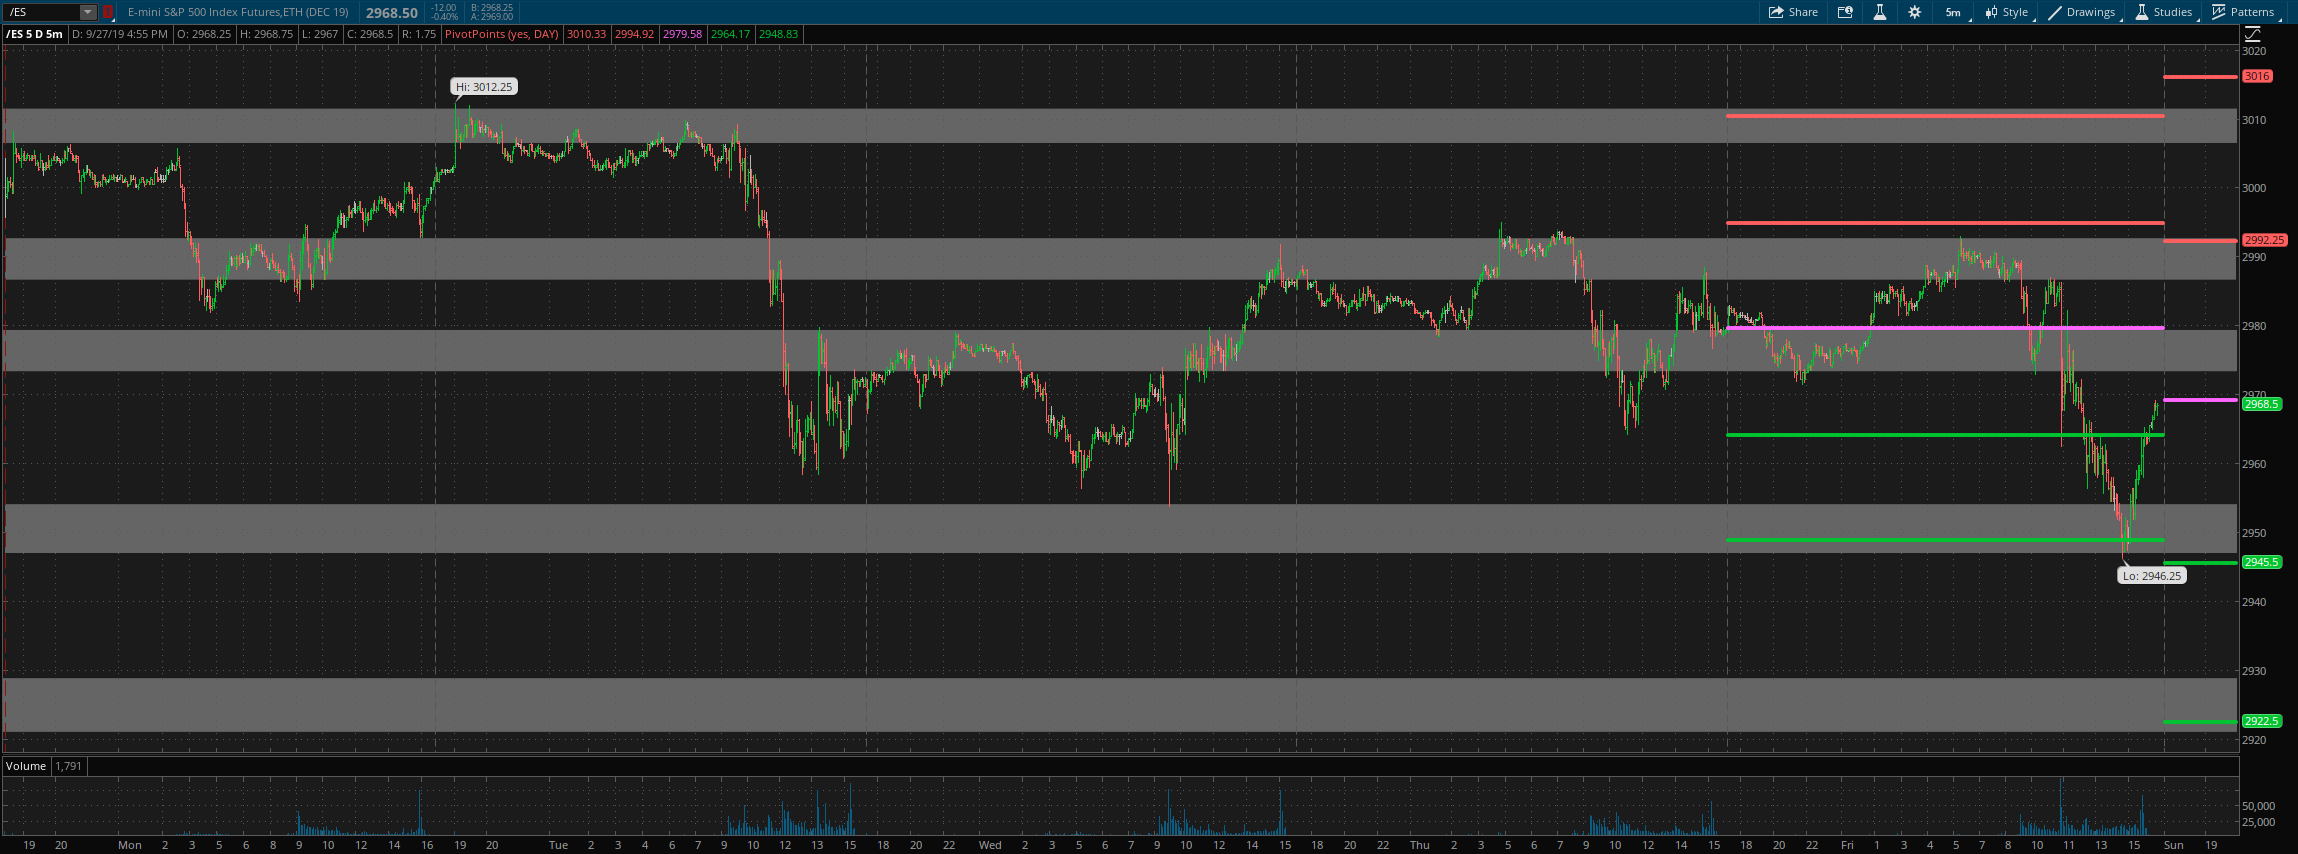
Daily pivot is at 2969. Resistance R1 is at 2992 and R2 at 3016. Support S1 is at 2945.5 and S2 at 2922.5.
All the best to your trading week ahead.
