Silver and gold - Market Analysis for Aug 24th, 2018
 By
By
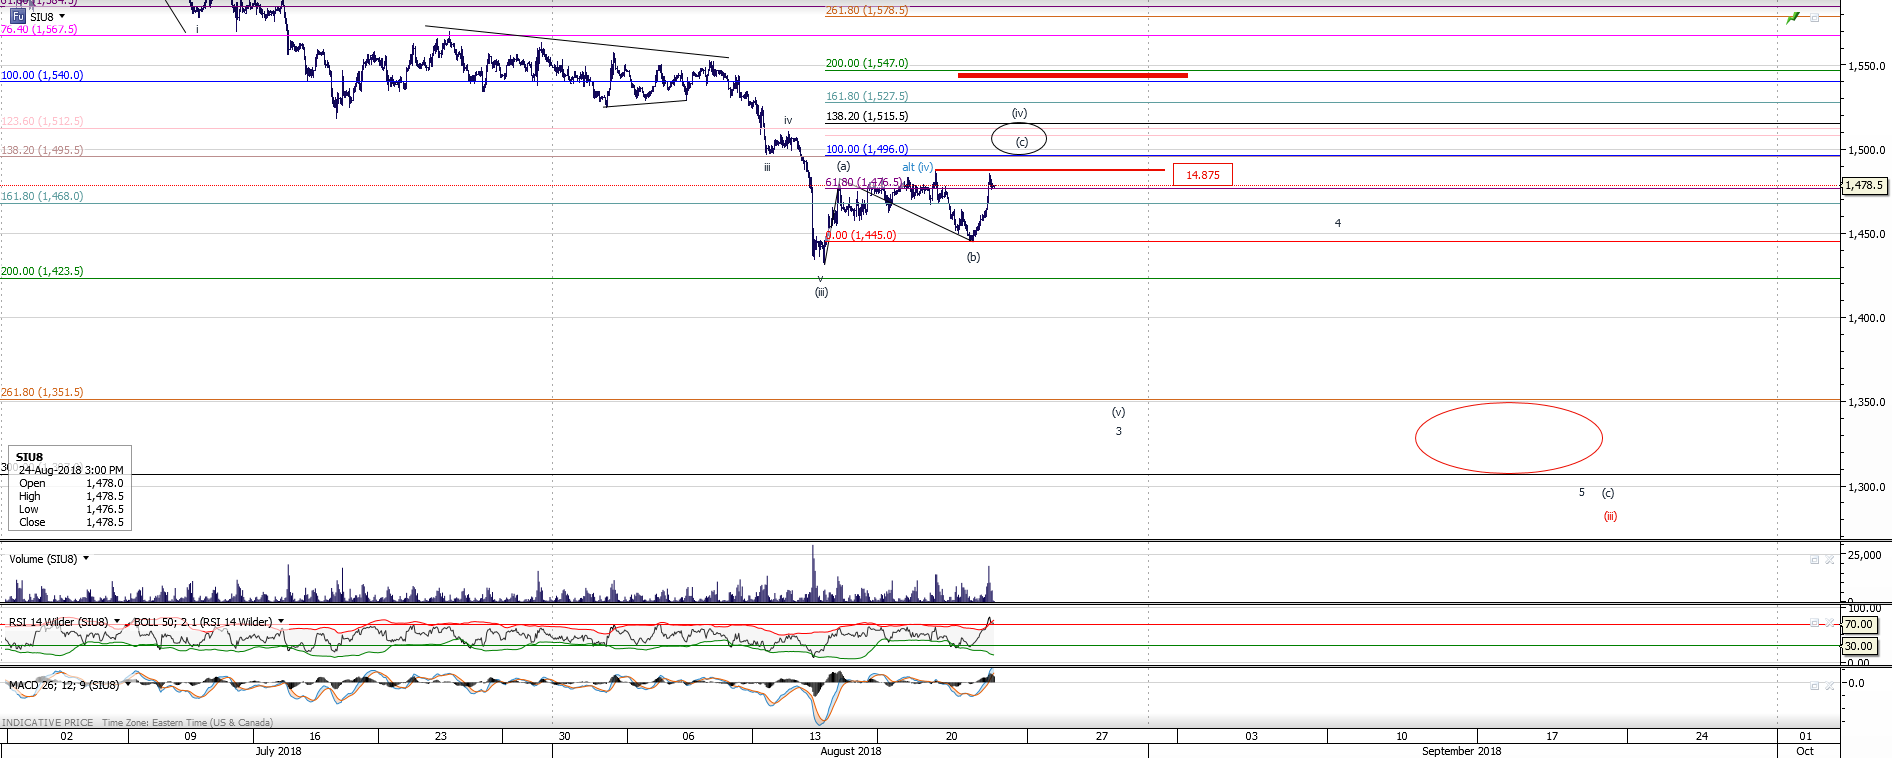
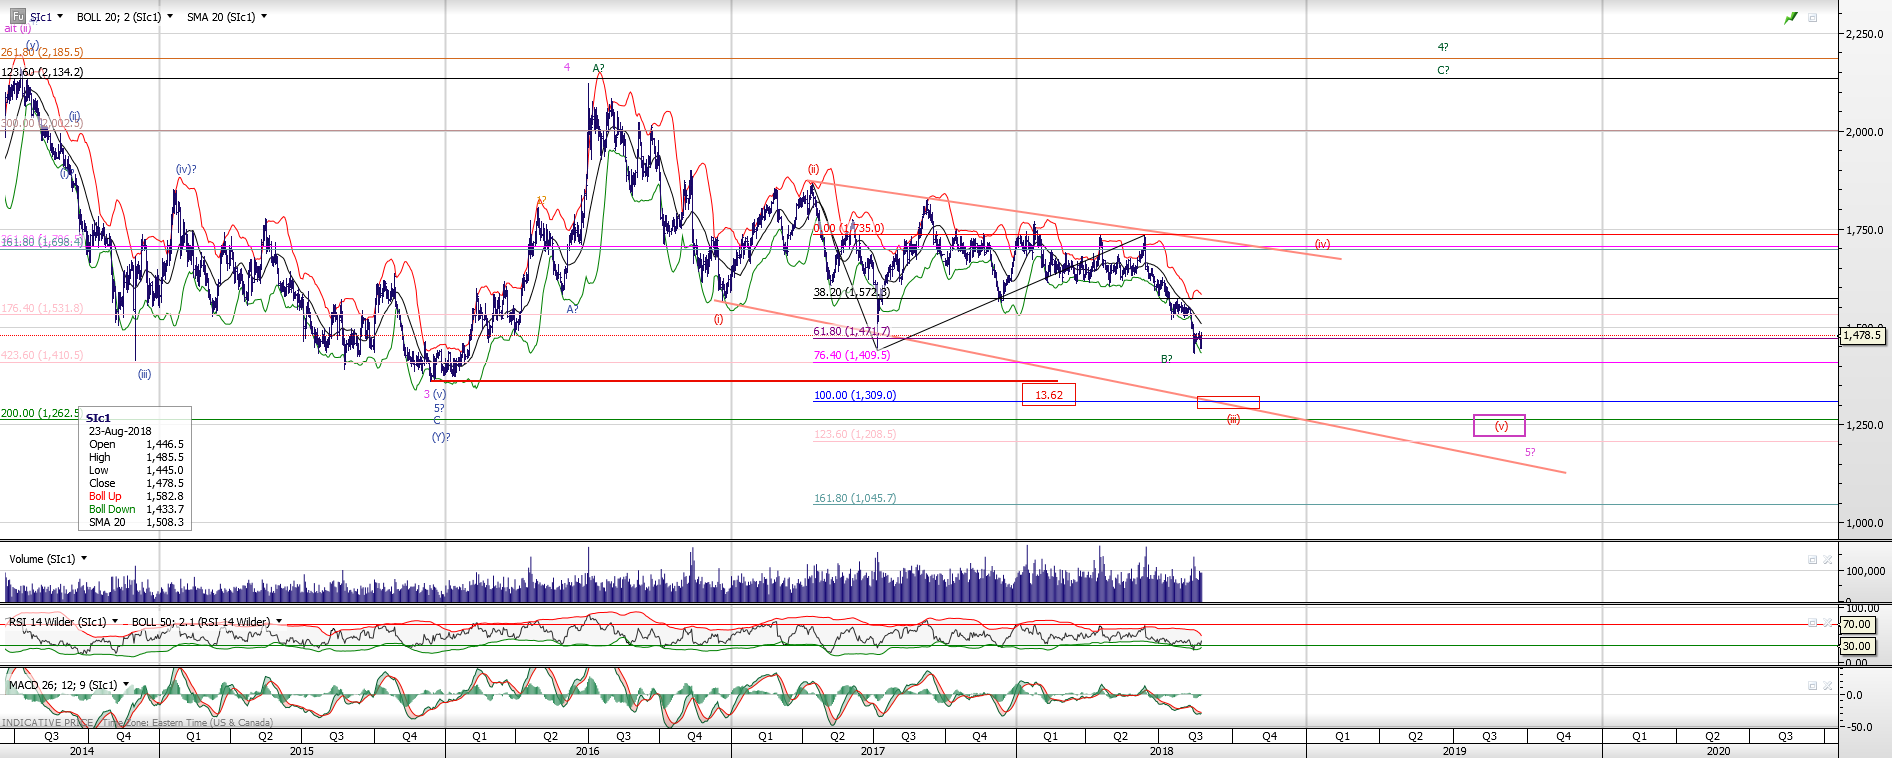
Silver: black wave (c) of (iv) certainly looks better than the blue alt (iv); I maintain prior analysis suggesting a drop to 13.50 - 13.10 area next.
Please note - triangles are taken off the daily chart and I only have a larger degree ED to a lower low and the green B-wave count for decline we are seeing.
Triangle count might be restored in the case this messy overlapping consolidation will resume - but right now it would just over-complicate the chart.
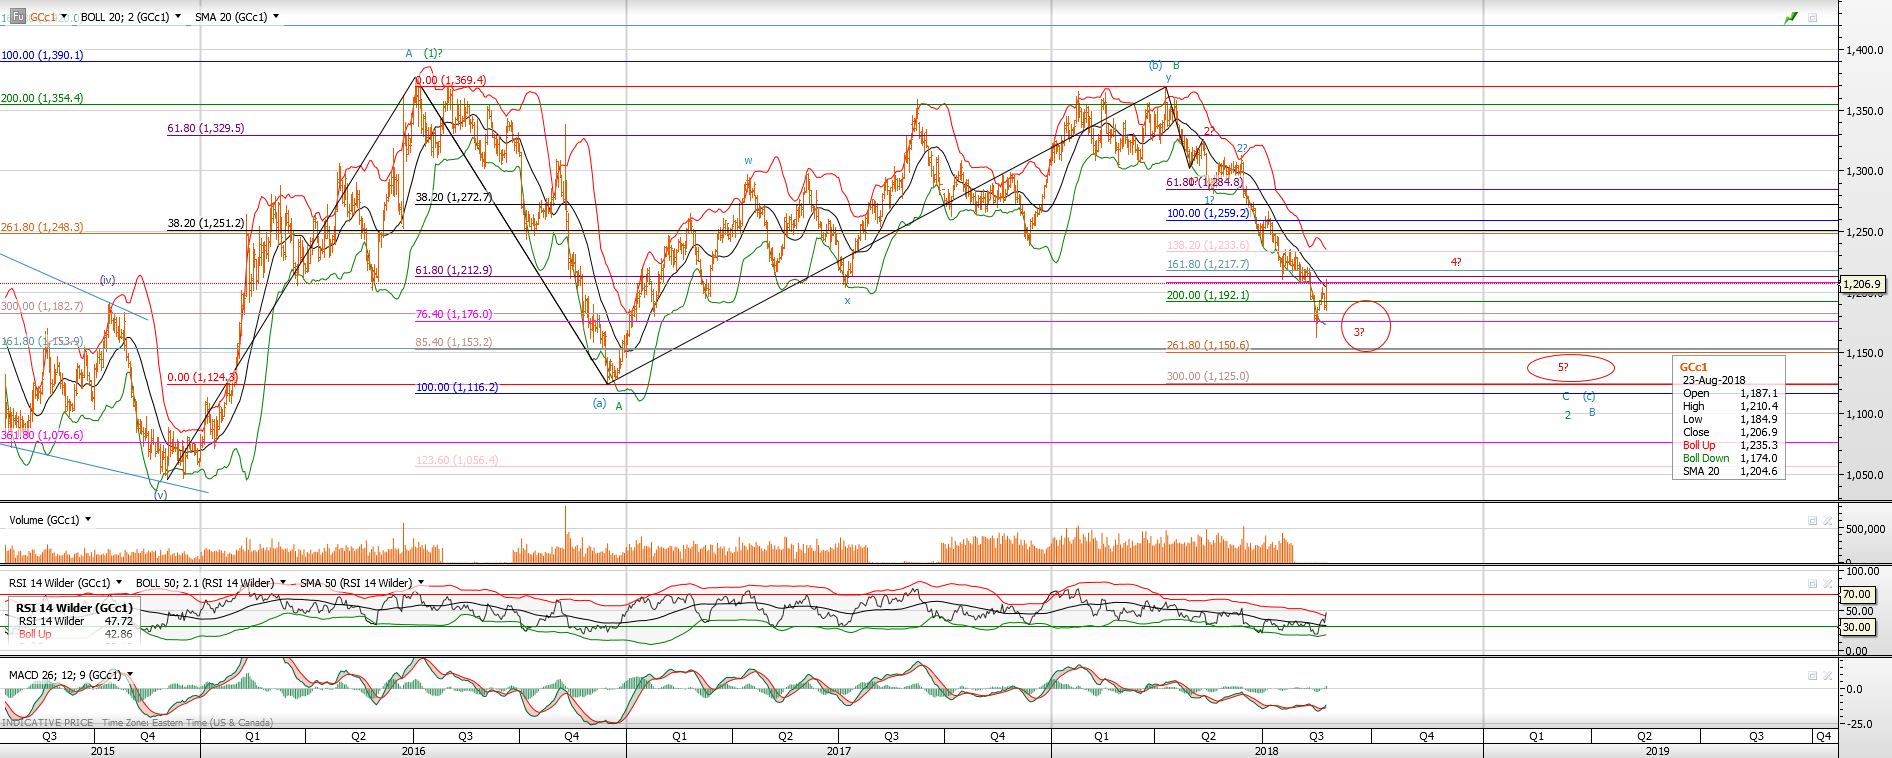
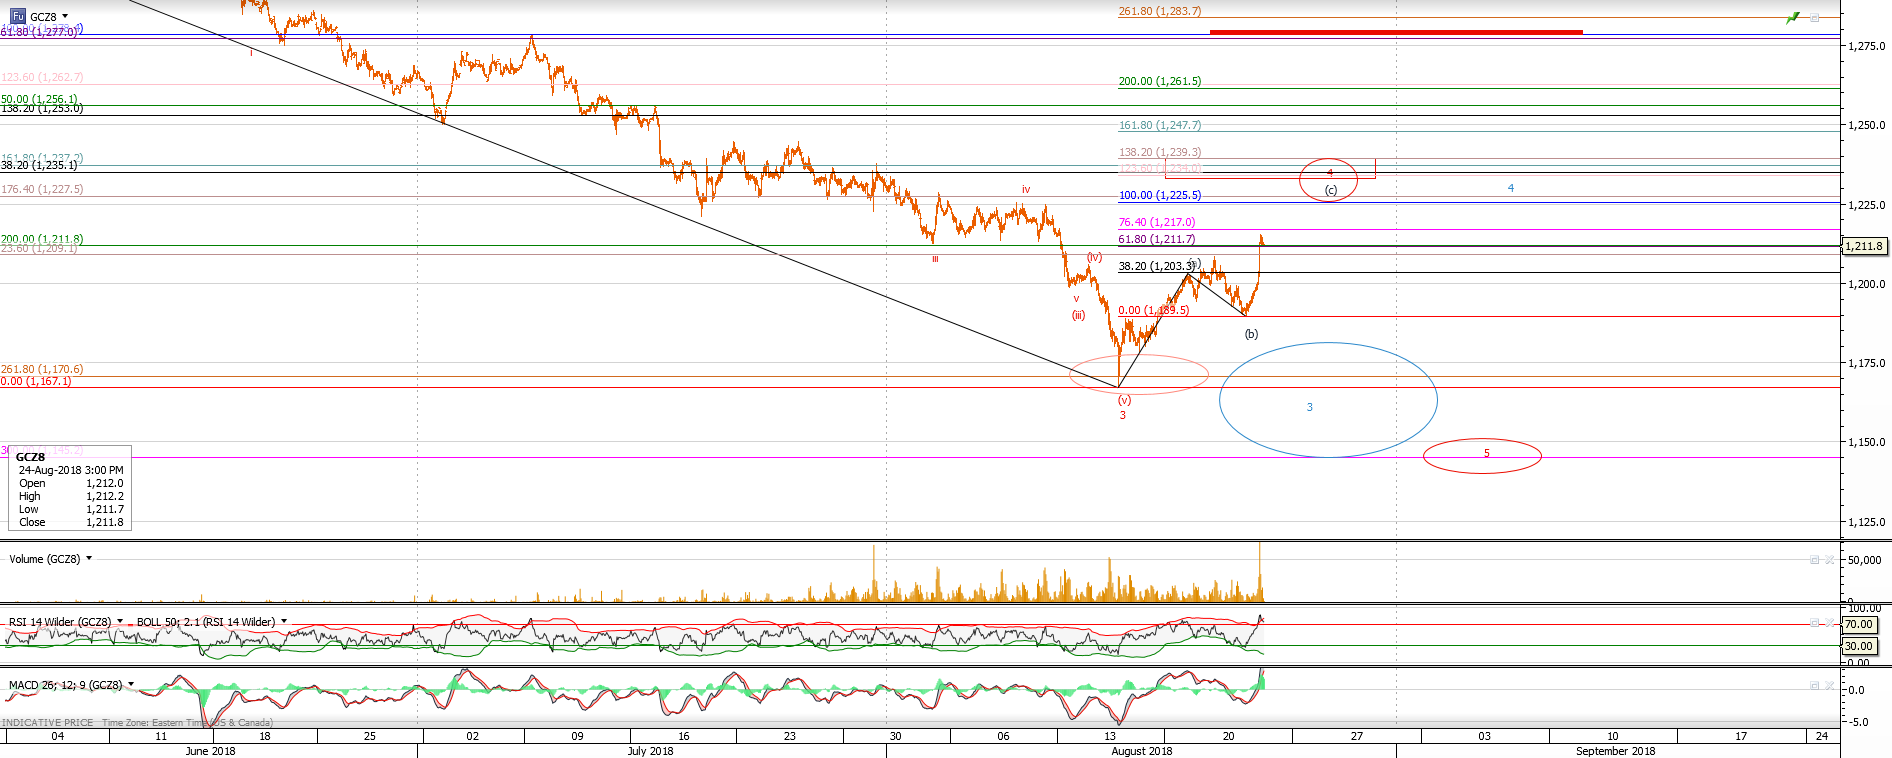
Gold: we have daily overbought signal in place - though extension to 1233 area still may be seen (hourly chart suggests extension to 1225 - 1239 area). Lower lows are still my preference; the only thing to note is difference between the regular and continuous contracts - while the regular contract suggests the target in the 1145 - 1150 region the daily chart is pointing to 1125 target region.
Either way we are nearing a major low (possibly - larger wave 2 bottom) and next move down could provide us with rare trade opportunity. Difference between 1125 and 1150 looks insignificant given a huge rally potential we will probably see unfolding in a few weeks or months.