Setting Up for Short-Covering Rally?
 By
By
In last weekend’s update, I noted that the S&P 500 was still below the bigger timeframe resistance zone at 2809-25. That's a level I have been noting for a while is tough for me to see us exceeding without some sort of consolidation or a bigger pullback lasting for more than a few days.
I wrote: "And even if we do not pullback a lot, there should at least be some consolidation in time before we can advance further. While I still would like to see a bigger pullback materialize here below the 2809-25 zone, the fact that we consolidated in a narrow zone last week giving nothing much to the bears makes me question if something more bullish can happen here. Imagine how many stops are placed right above the 2809-25 zone?…. it would be just like the market to take them out, remove a majority of shorts out of the equation… a short covering rally lasting 50-60 points higher… and THEN reverse for our bigger pullback."
My initial idea of a consolidation below the major resistance zone of 2809-25 was the correct one.
What's next?
We hit the major resistance zone, pulled back, took support at the 2780/75 area and went right back up to close near the major resistance zone. Nothing much given to the bears.
So the same idea from last week remains valid here maybe more so this week. There should still be many stops placed right above the 2812-25 zone. It would be just like the market to take them out -- remove a majority of shorts out of the equation -- creating a short covering rally lasting 50-60 points higher … and THEN reverse for our bigger pullback.
On Friday, we backtested a small triangle breakout. This triangle gives us a target of 2840-50. Get through the 2812-25 triple top zone will open up 2850 first and then the 2880-2900 zone opens up. From one of these areas, we should finally get our bigger pullback started.
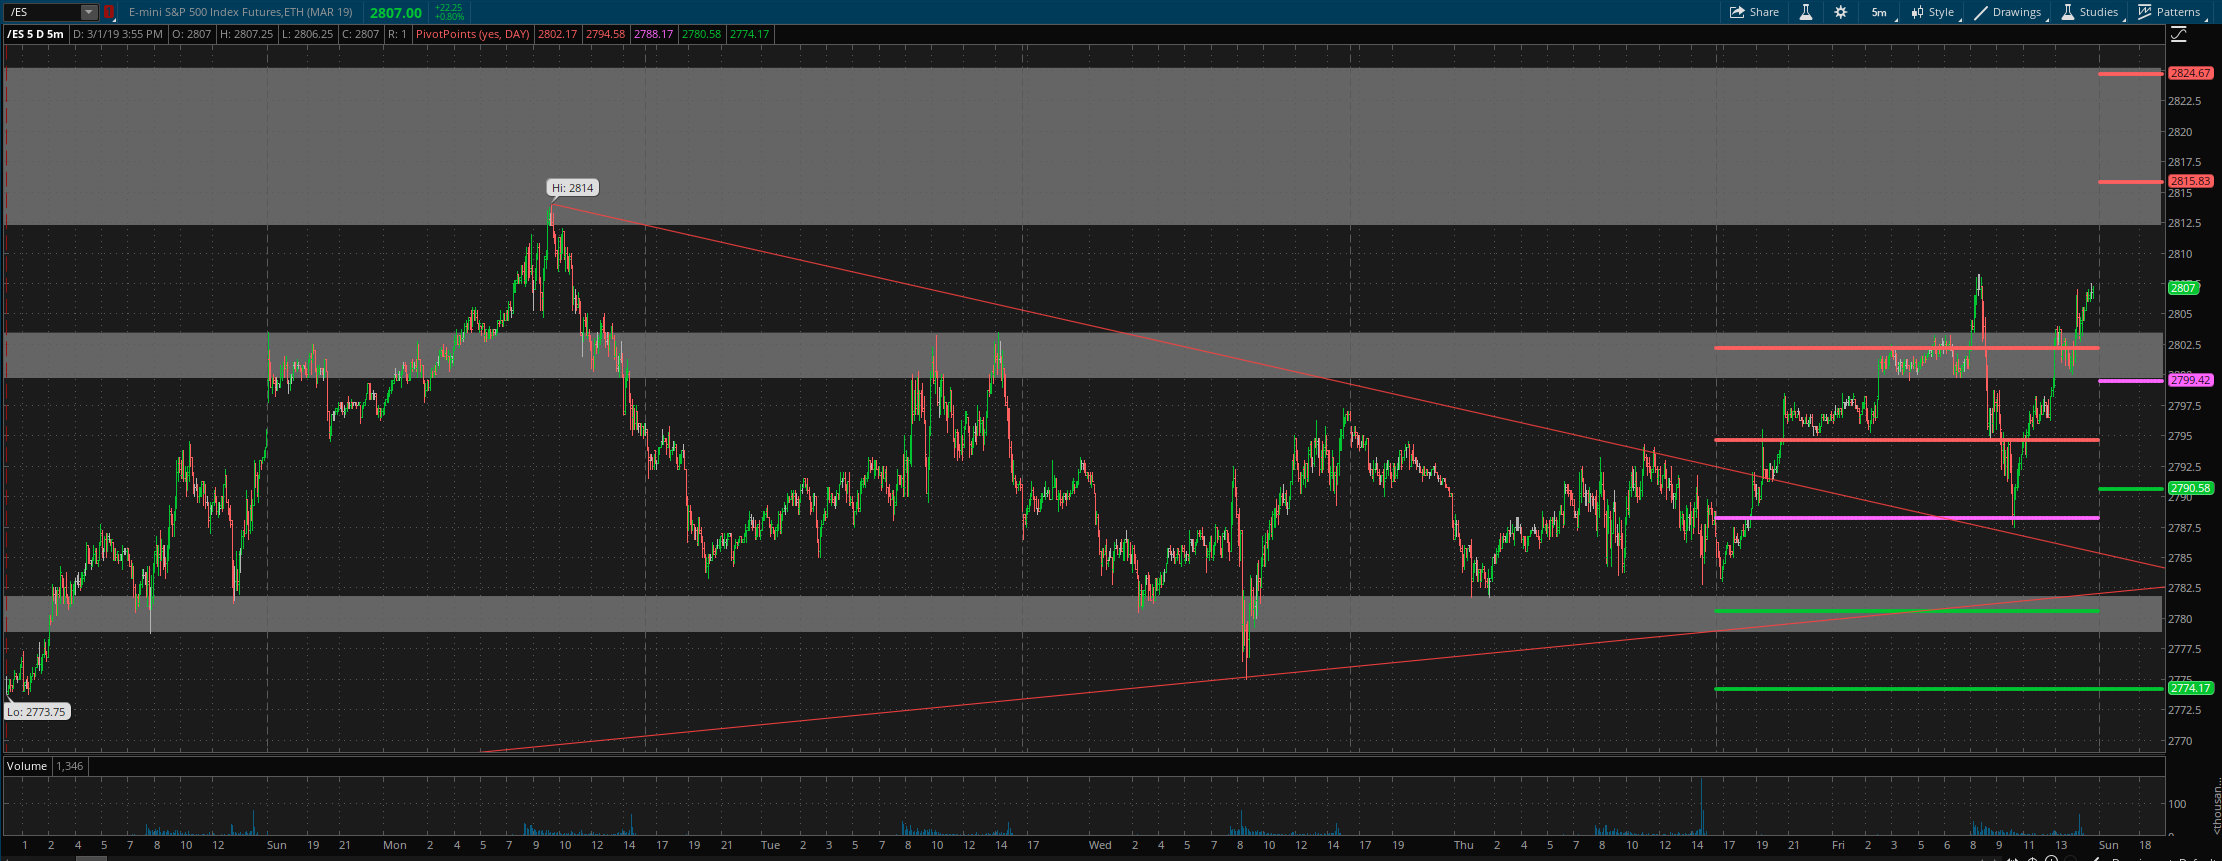
ES Grey Zone areas - We are right below the major resistance zone at 2812-25. On the downside, we have support at 2803-2800 and then 2782-78, then 2765-58. This last zone still remains the most important one for the intermediate term bullish case.
ES daily pivot is at 2800. Resistance R1 is at 2816 and R2 is at 2825. Support S1 is at 2790.5 and S2 is at 2774.
All the best to your trading week ahead.
