Seeing the forest through the trees
 By
By
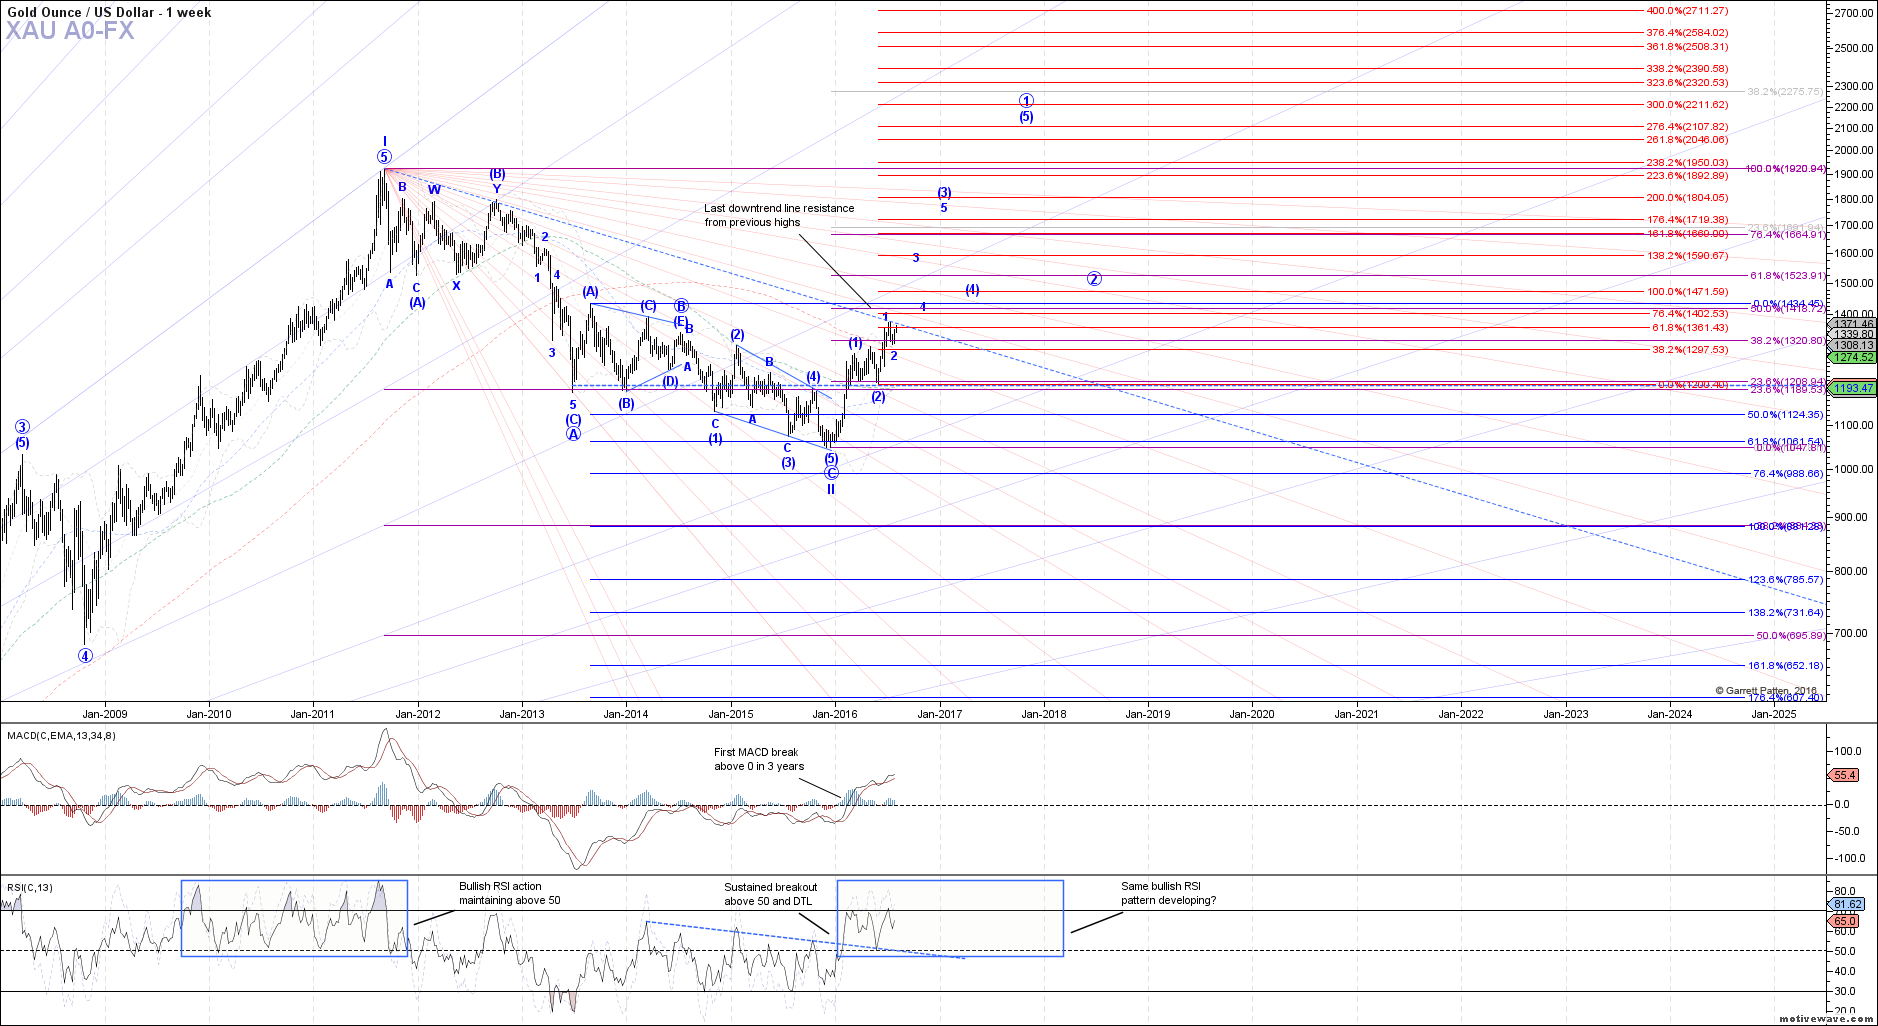
Quick look at gold's weekly chart because it is always important to zoom out from time to time :).
Since the low struck in December of last year, we have seen some very healthy technical developments for sustained upside to continue. Along with price breaking above and holding the important 1200 pivot level, weekly MACD and RSI have cleared important resistance as well.
The MACD has gone positive by crossing over the 0 level for the first time in 3 years. RSI has also made a sustained break above the 50 level and held that level on a back test, which is equally as bullish. Both are pointing higher still and stochastics (the faint blue line behind the RSI) is arguably embedded above the 70 level.
With this technical backdrop and price sitting right beneath the last downtrend line from the previous highs, we have a setup ripe for a breakout. This aligns perfectly with the operative count as a (1)-(2) 1-2 setup off the December low. As long as price remains above the 200 week SMA (currently ~1300), it is hard to view this chart as anything but bullish.