Riding the Stockwaves: Technical Update on ROKU
 By
Jason Appel
By
Jason Appel
“From a fundamental standpoint, Roku’s valuation has been completely reset. It is now below average in terms of its average valuation, and continues to have robust growth” -Lyn Alden from her 2/12 article, “Where Fundamentals Meet Technicals: ROKU, MELI”
To be sure, ROKU’s valuation reset was not a garden variety bull market pullback. Instead, ROKU fell 79% from it’s all-time high in July 2021 to the recent low of $102.60 struck on February 18th. The company’s price to sales ratio fell from a meteoric 33+ down to 5.5. What changed?
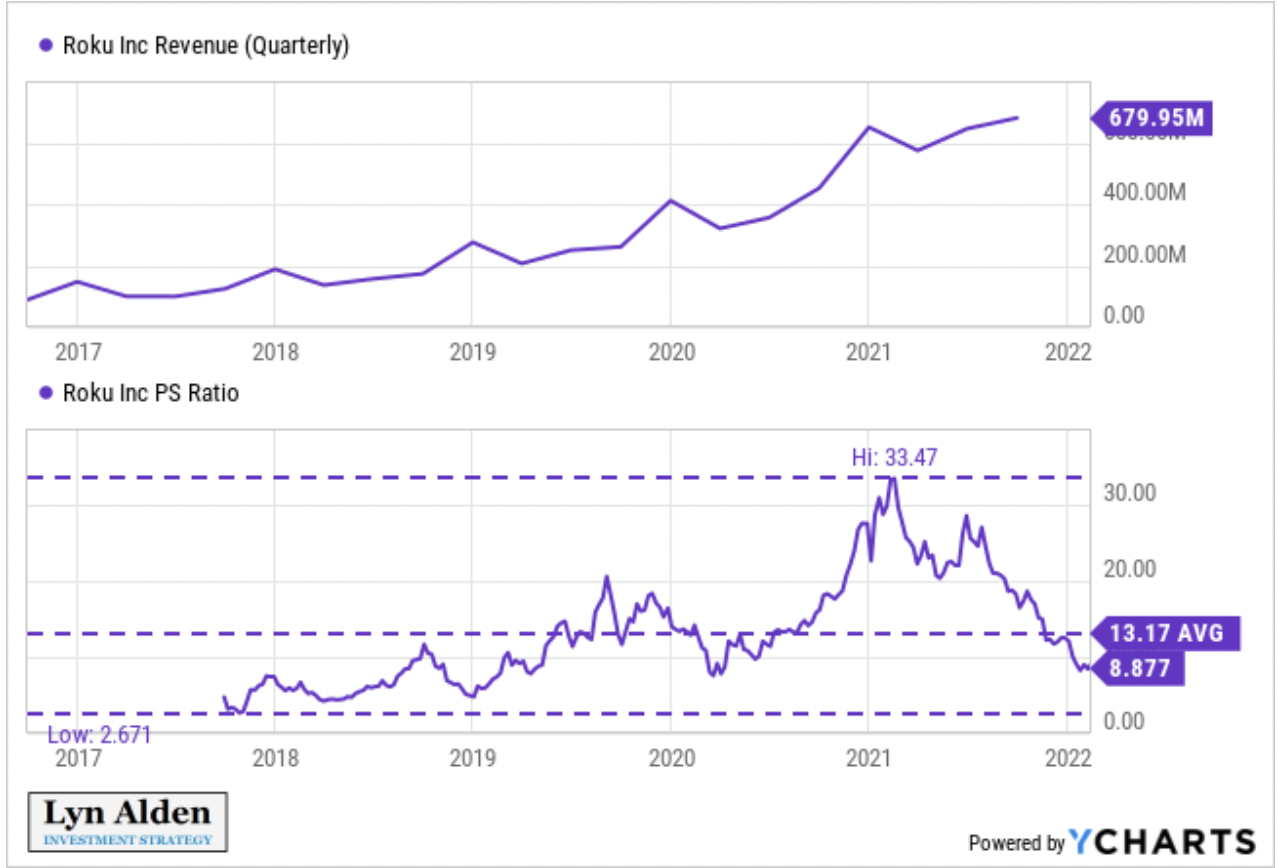
Note, revenue has continued to grow amidst this plummet in the stock price. Q4 2021 revenue did miss analyst expectations by 3.2%. However, on the positive side, net revenue grew by 55% year-over-year in 2021 and gross profit grew by 74%. Regarding the 2022 outlook, the expectation of global supply chain disruptions will likely reduce television sales, which adversely affects ROKU’s account growth, but due to increased advertising, content promotion, and content distribution, total sales are expected to grow by 35% (specifics sourced from the recent Q4 2021 Letter to Shareholders).
From a technical perspective:
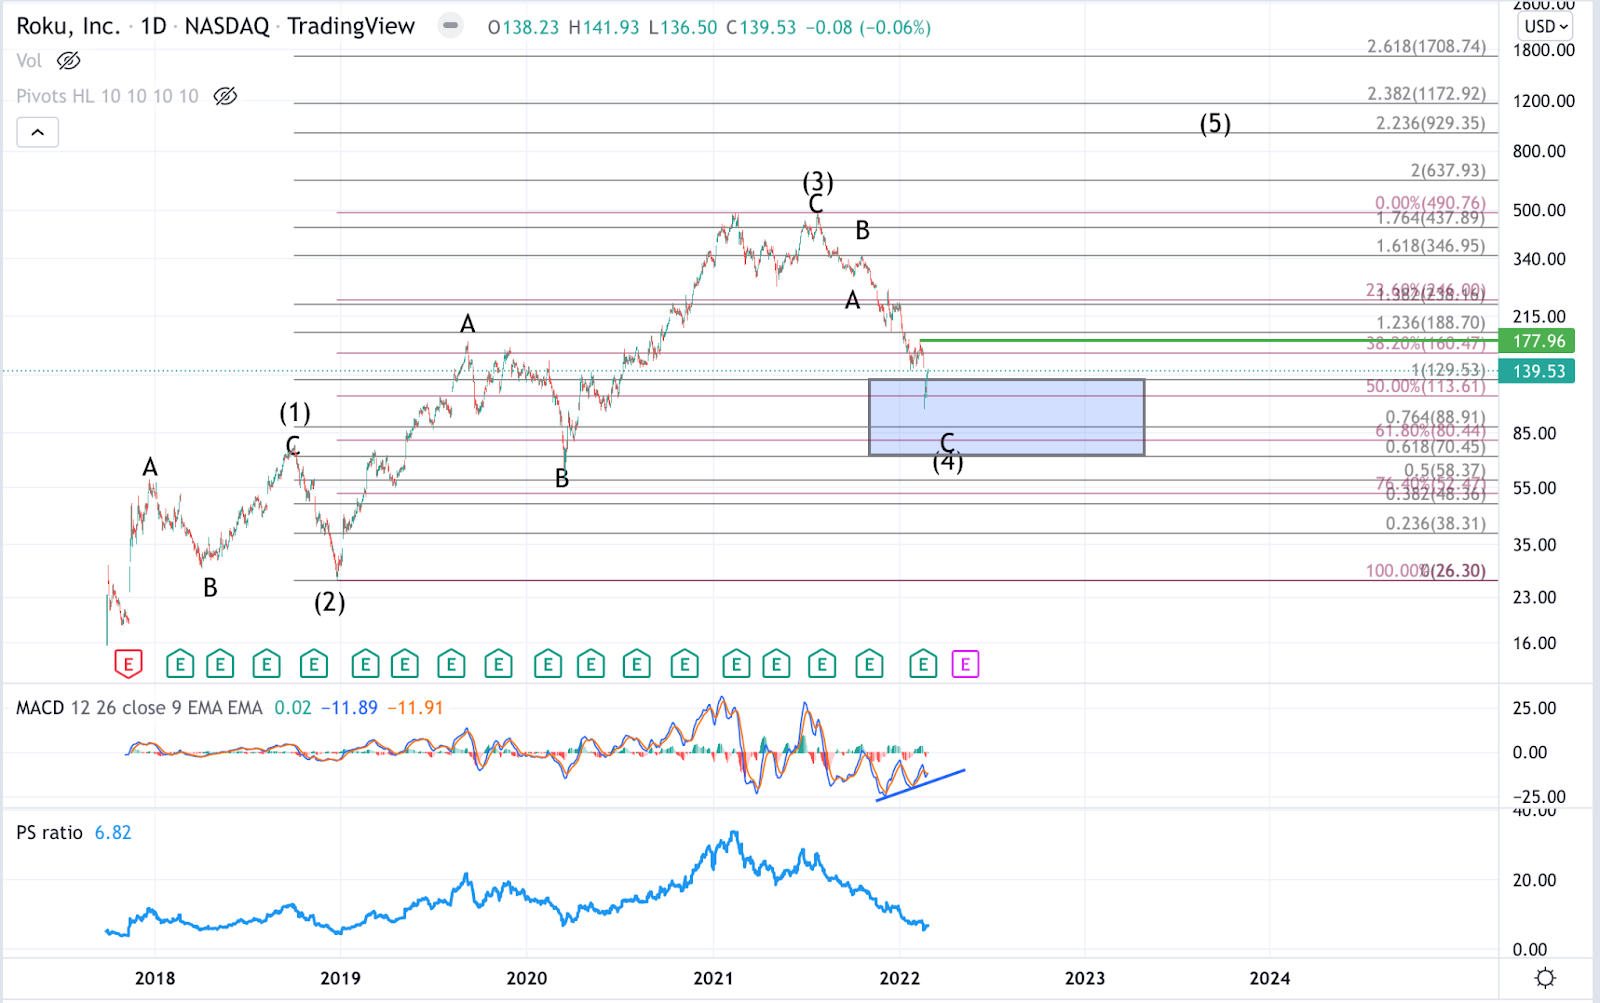
ROKU has had 3 waves up from its inception. While the structure does not satisfy conditions for an Elliott Wave impulse, it does appear to be forming a larger diagonal. As the expectation is for a diagonal, the pattern still favors another rally to a new all-time high over the next few years to fulfill the 5th wave up.
A diagonal is a 5 wave pattern in which the subwaves: (1)-(2)-(3)-(4)-(5) are each composed of 3 wave moves, labeled A-B-C. While still a trending pattern, this is unlike an impulse in both its internal structure (within impulses, waves (1), (3), and (5) composed of 5 subwaves) and the allowance of a deep wave (4) pullback, even allowing for overlap into wave (1) territory. Thus far, price has maintained without overlap with (1) and overall, this pullback, while massive in percentage terms, has only retraced a bit beyond the 50% retrace of wave (3). In Fibonacci terms, this is quite standard for wave (4) in a diagonal.
In terms of the microstructure, unless price gets a rally back above $180 on a sustained basis, I can’t rule out one more low targeting the $80 region to fill out a more complete C wave.
That said, so long as ROKU is able to avert any sustained break below $58, one more all-time high is favored to complete the larger expected structure in wave (5). As such, while large positions are premature without a decent confirmation of a low (that would come with a sustained break above $180) initial small positions offer decent risk-to-reward; should sellers avail us of lower lows down to $80, such a development would offer magnificent risk-to-reward.
Lastly, though technicals ought to be viewed as secondary to price action, the MACD is making successively higher lows on each new low in price. In other words we have some nice positive divergences on the Daily chart.
Again so long as price is able to keep from any sustained break below $58, the next rally is favored to be setting up. As mentioned above, Price to Sales went from 33 to 5.5 in a thriving business that expects continued growth. What’s changed? Likely sentiment. This is exactly what’s expected in accord with a wave (4) and this is what provides investors with a chance to buy cheap for the wave (5) when sentiment surges once again.