Riding The Stock Waves: Technical Update On Amazon
 By
Jason Appel
By
Jason Appel
Riding The Stock Waves: Technical Update On Amazon
Amazon (AMZN) had a massive year in 2020. The tech behemoth gained 76% on the year and rallied 118% from the March lows into the early September highs, resoundingly outperforming the Nasdaq-100 Index (NDX), of which it is the third biggest component stock, only following Apple (NASDAQ:AAPL) and Microsoft (NASDAQ:MSFT). However, so far in 2021, while the NDX is up 5.37% as of the market close on Friday, Feb. 19, AMZN is flat on the year (down 0.22%). We see this year-to-date underperformance as likely short lived and expect AMZN to renew its outperformance in the next larger rally.
Fundamentally speaking, AMZN is quite solid. In StockWaves at ElliotWaveTrader.net, Lyn Alden Schwartzer recently posted the following on AMZN:
“The balance sheet is strong, and overall, there’s a decent amount to like here. One of the catalysts for an upturn could be better-than-expected quarterly results. Sentiment might start to price that in ahead of time, as it did today when good nationwide retail sales numbers came out.”
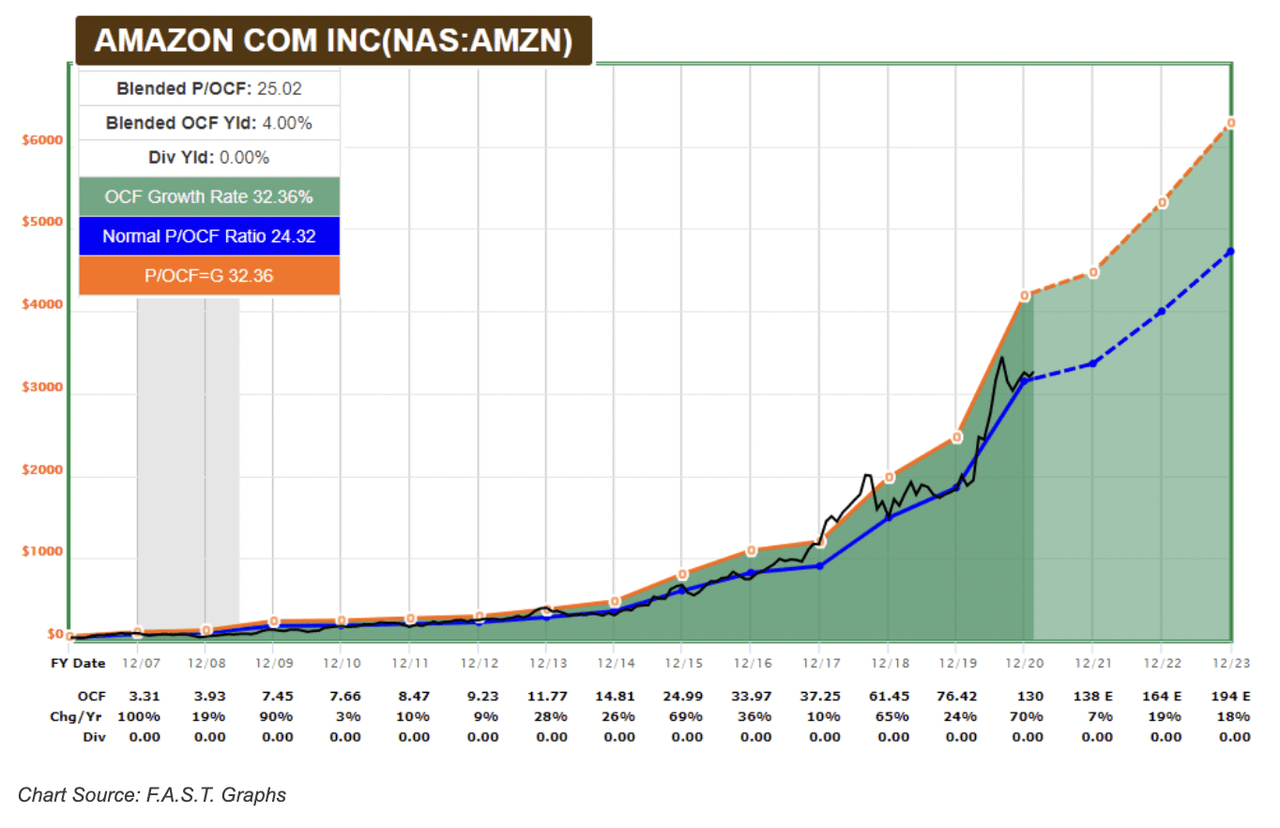
Regarding valuation, she stated: “Amazon historically follows a 25x operating cash flow multiple quite closely, and is currently in line with that norm. Its earnings have always been an unreliable valuation indicator, but its operating cash flow has been reliable.”
See below the accompanying FAST Graph.
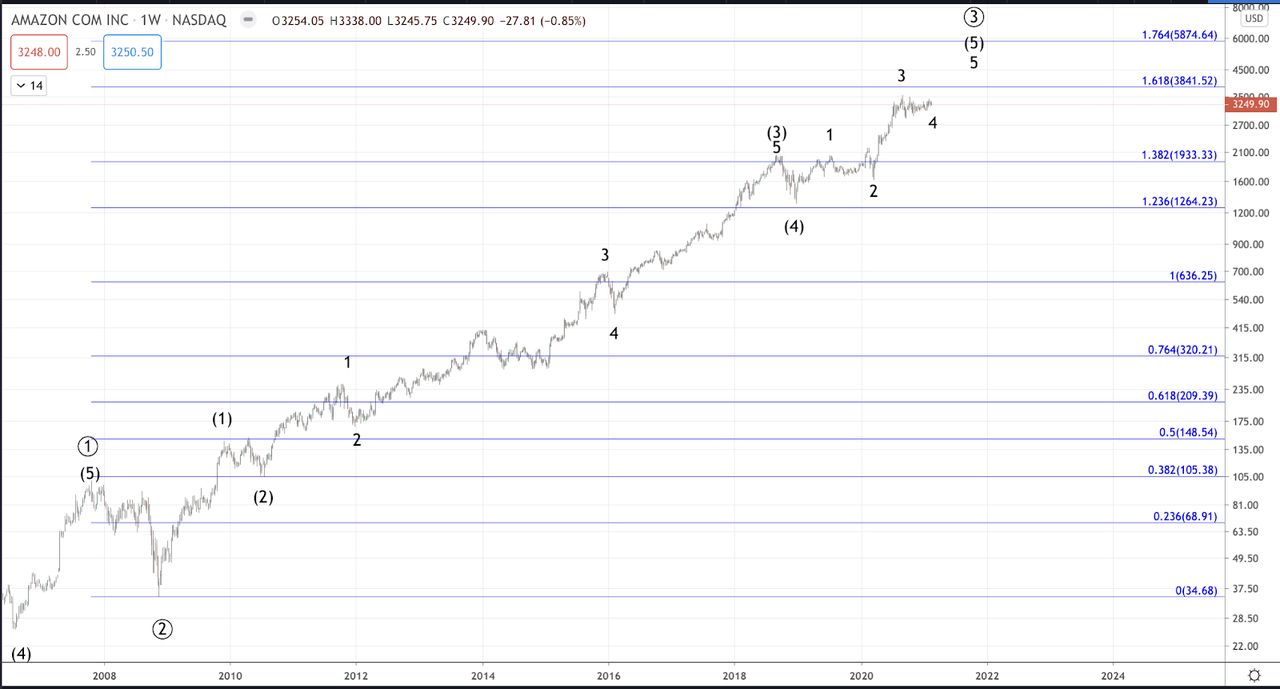
AMZN has rallied off the September 2001 low in what's referred to in Elliott Wave Analysis as an impulsive pattern. Impulses (for short) form 5-wave patterns in the direction of the trend. As AMZN has had an incredible run, we see the impulsive shape as reflective of very positive mass sentiment for the stock. At the large degree, price is close to completing the Primary 3rd wave off the 2001 low (See Weekly Chart).
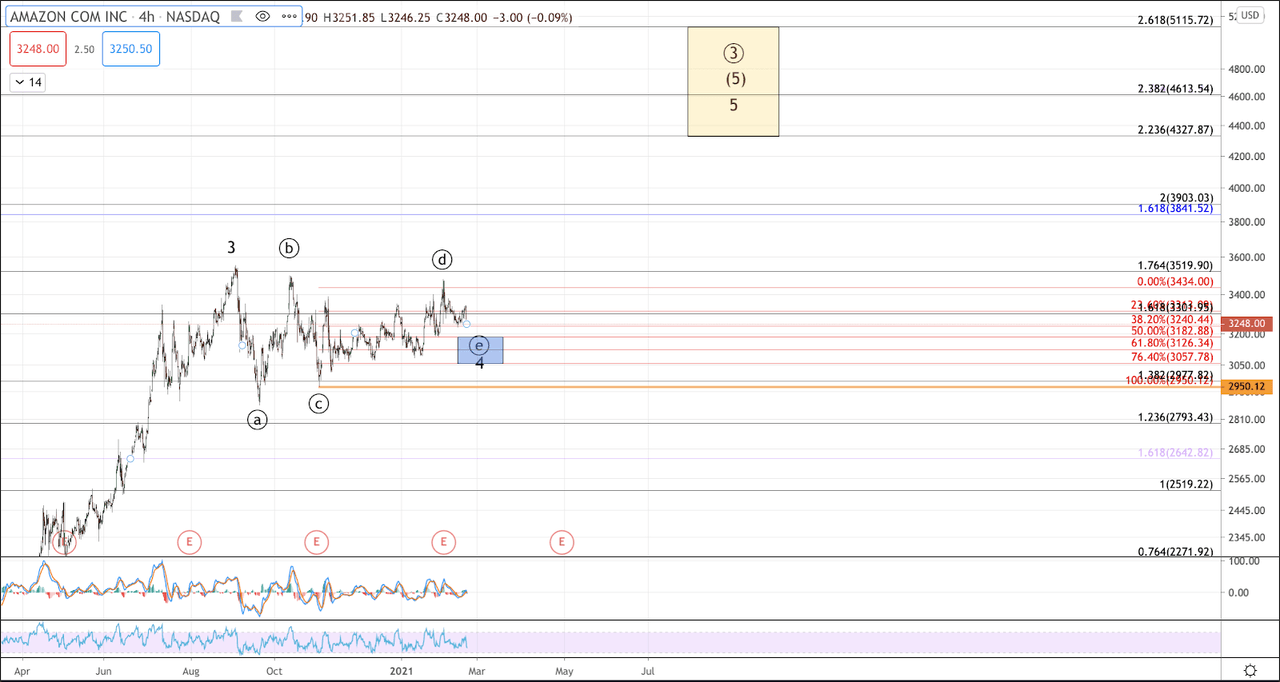
The final portion of Primary 3 (labeled (5) and circle 3, respectively) is expected to complete some time later in 2021 or perhaps early in 2022. The move commencing from the December 2018 low into the September 2020 high comprises the first 3 waves of (5). Since September 2020, price has consolidated in a sideways range-bound fashion. The shape of this consolidation is referred to as a triangle in Elliott Wave, and when triangles occur it is often in the 4th wave position. Price appears to be nearing the final portion of this consolidation, after which our expectation is for AMZN to resume its rally to the next larger degree target zone.
Ideal support for entry occurs in the $3,050-$3,185 region, but even an entry at current levels offers phenomenal risk-to-reward. A technical invalidation of the triangle would occur with a break below the November low at $2,950, but even if such a break were to occur, there's larger support all the way down to $2,635. On the upside, AMZN is targeting $4,327-$5,115 for wave 5 to complete (5) of Primary 3. That’s somewhere between a 33%-66% gain, depending on entries and exits.
We consider the parameters above and the overall pattern and AMZN’s fundamentals to all together represent a phenomenal risk-to-reward opportunity, but we must note: this is not intended to be a long-term buy and hold. While it’s certainly possible for price to exceed analysts’ expected targets, we do not view such activity as highly likely. Our forecast is for the next target to represent an important and lasting top, from which price could get a substantial pullback.
AMZN Weekly
AMZN 4H