Realized Vol Clues - Market Analysis for Apr 2nd, 2020
why mathematically i can not get on board with a bottom yet....
just 2 examples but i could give you all deep corrections or bears throughout history and they have same quantifiable metrics...
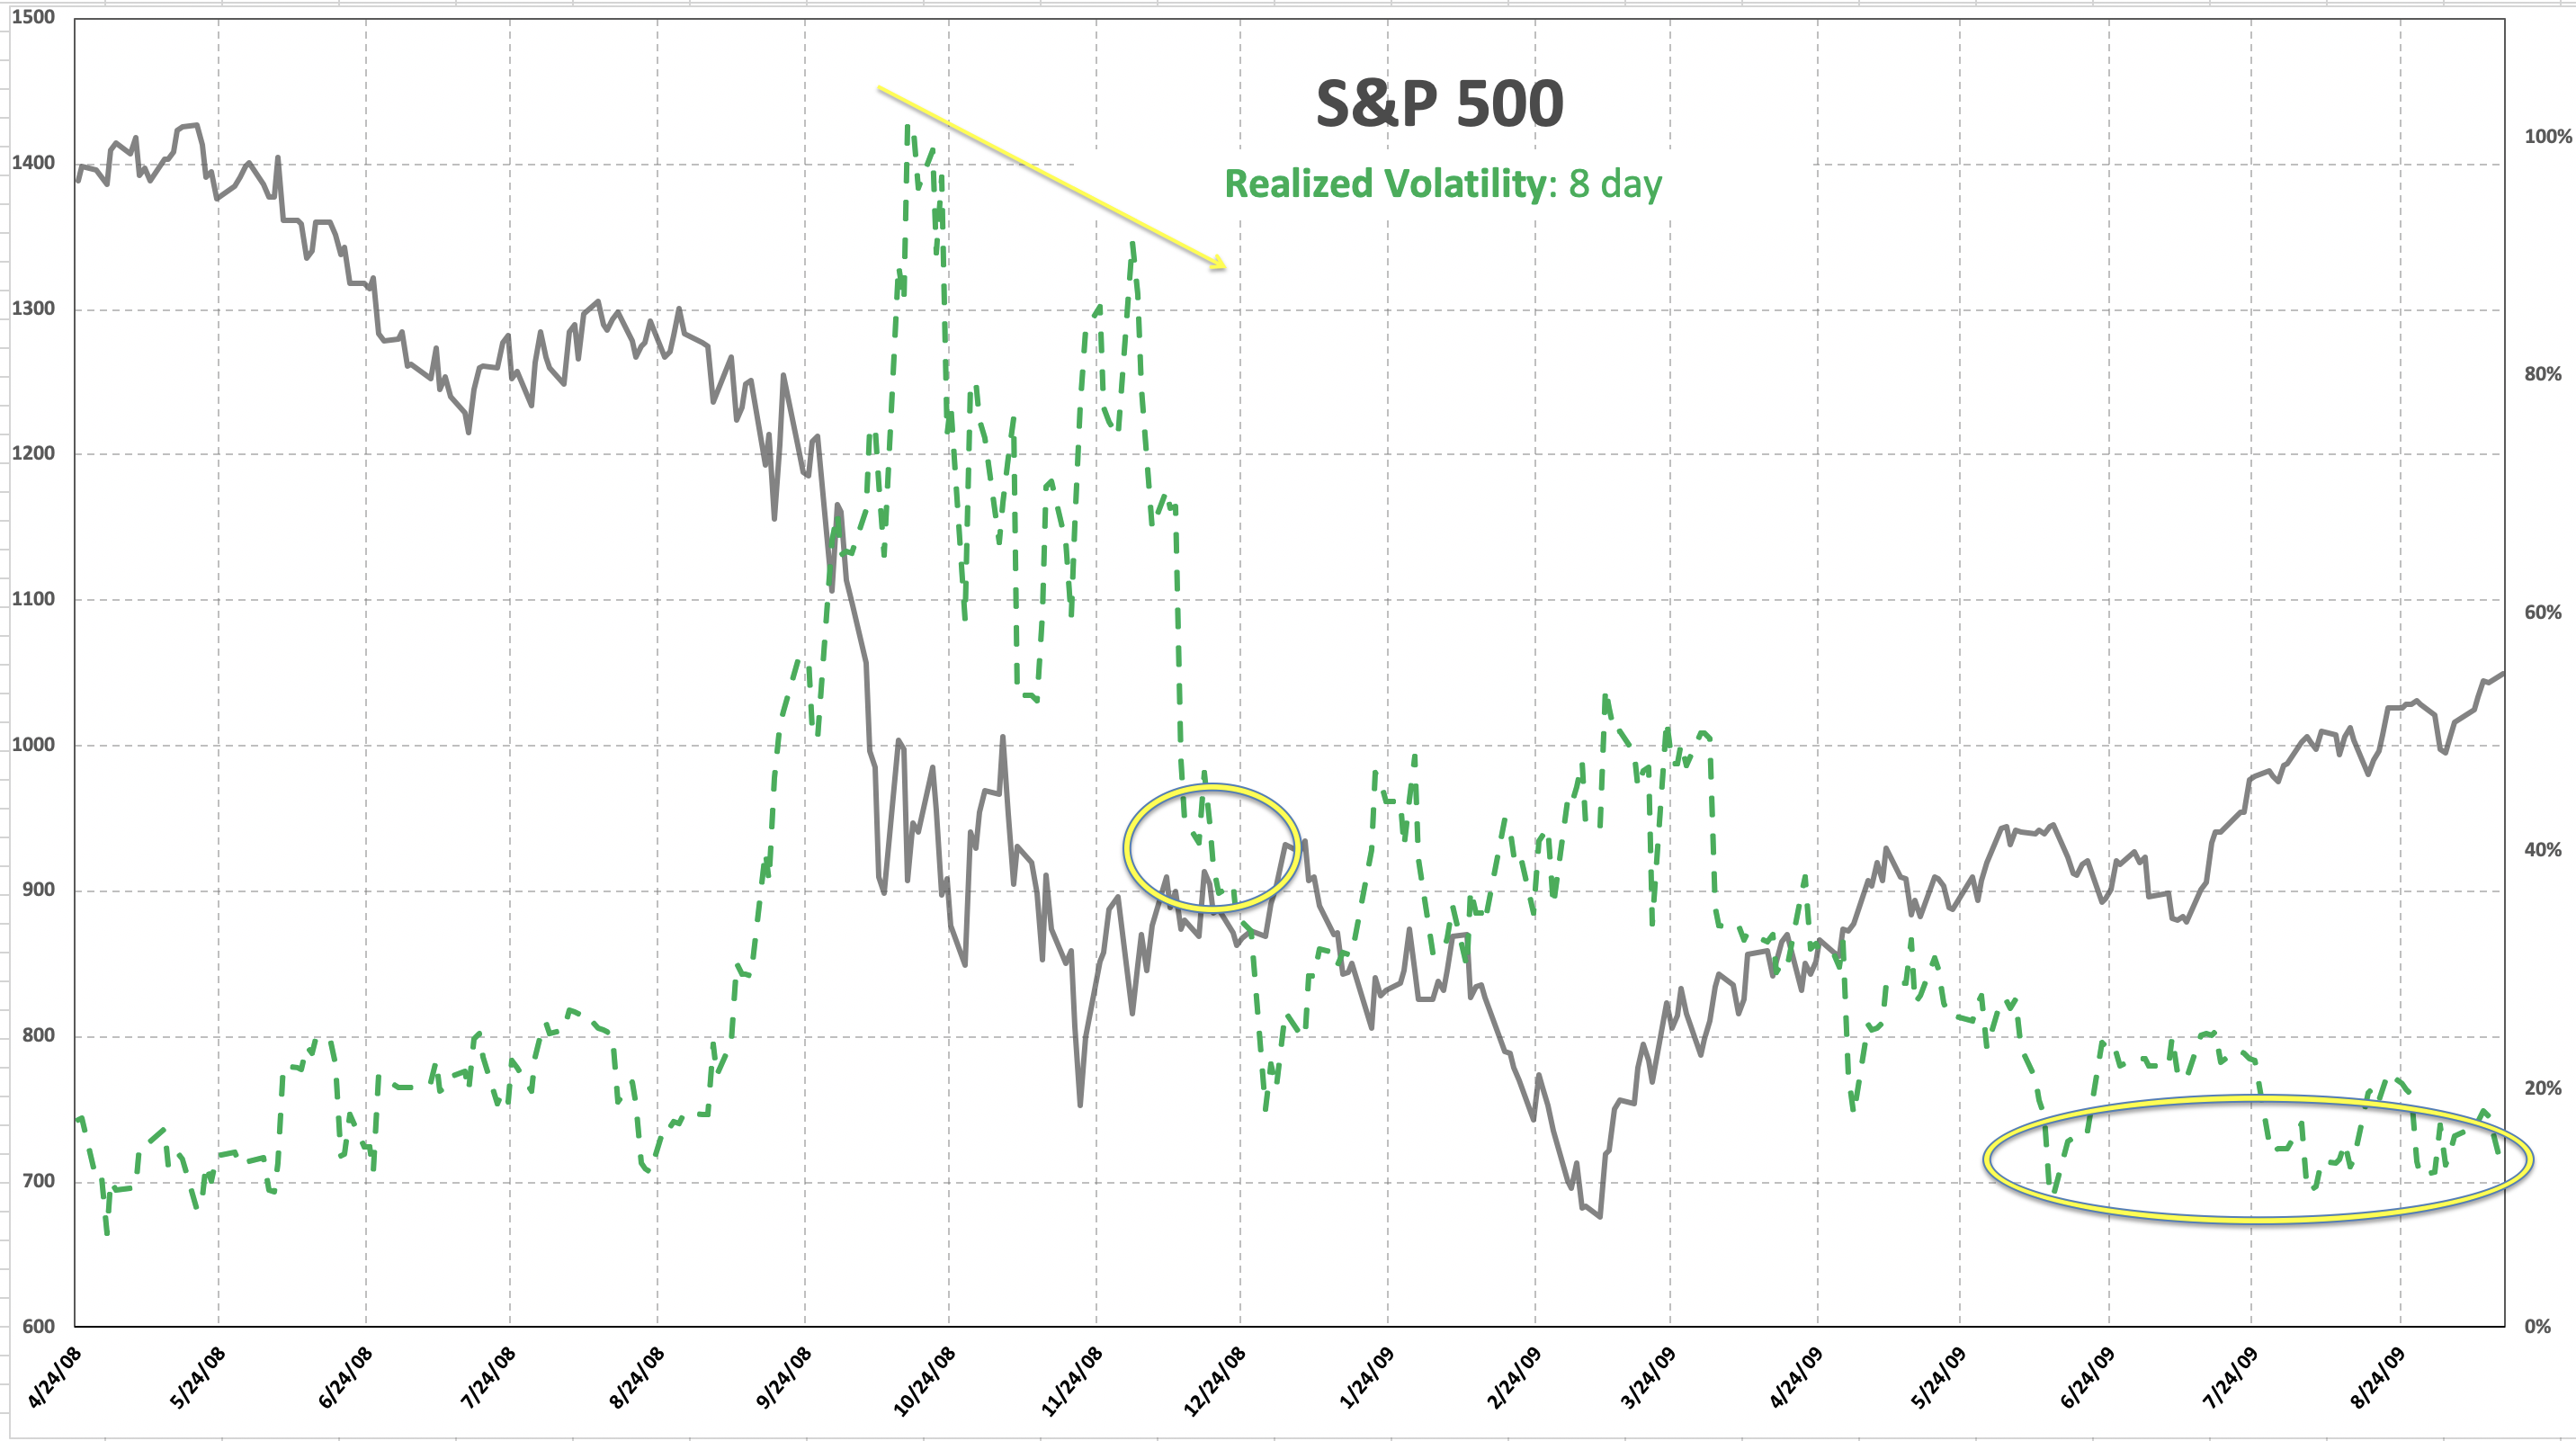
example 8 day Realized vol...
check out when it blew out in 2008....how long 1) it took to fall back below 40%...and then 2) when it finally dropped below 20%....those are two big thresholds that needed to clear...i circled them for you...
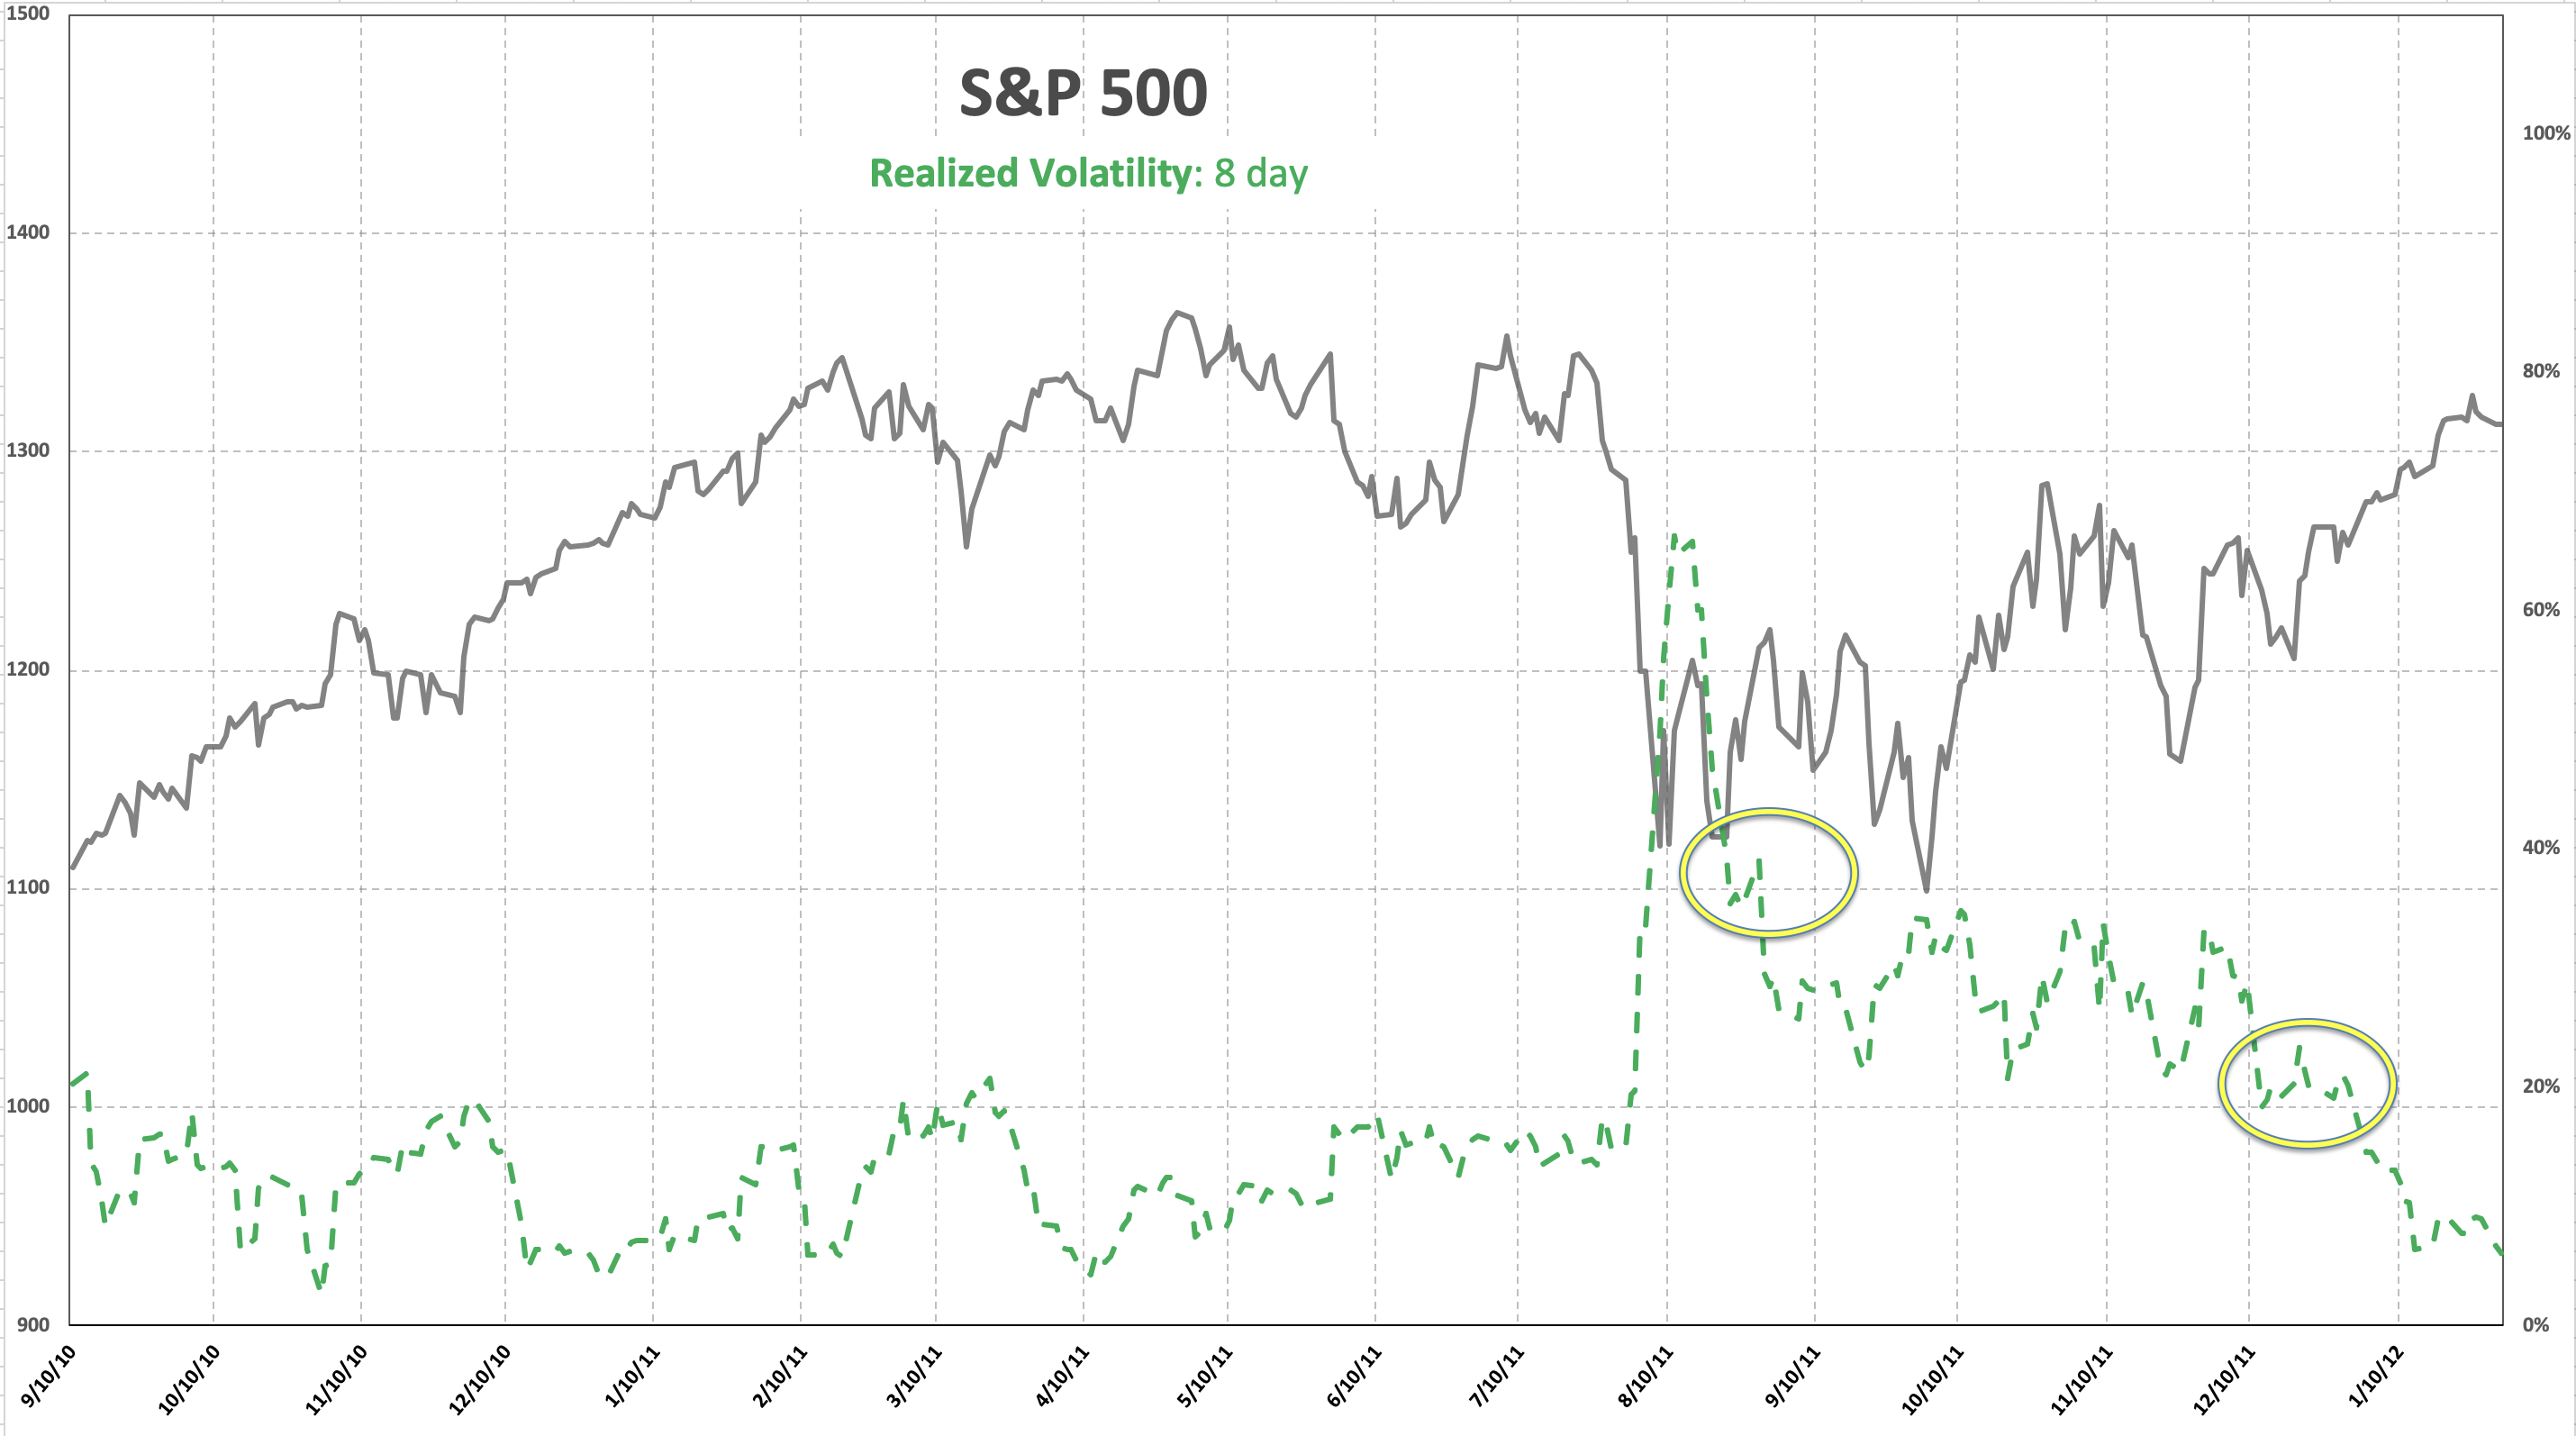
then check out 2011...much faster violent correction....but same thing....look there wasnt anything sustainable bottom wise till that came back below 40%....and that still delivered a DEEP retest of lows up above on price....and then below 20% finally was telling you worst was behind....
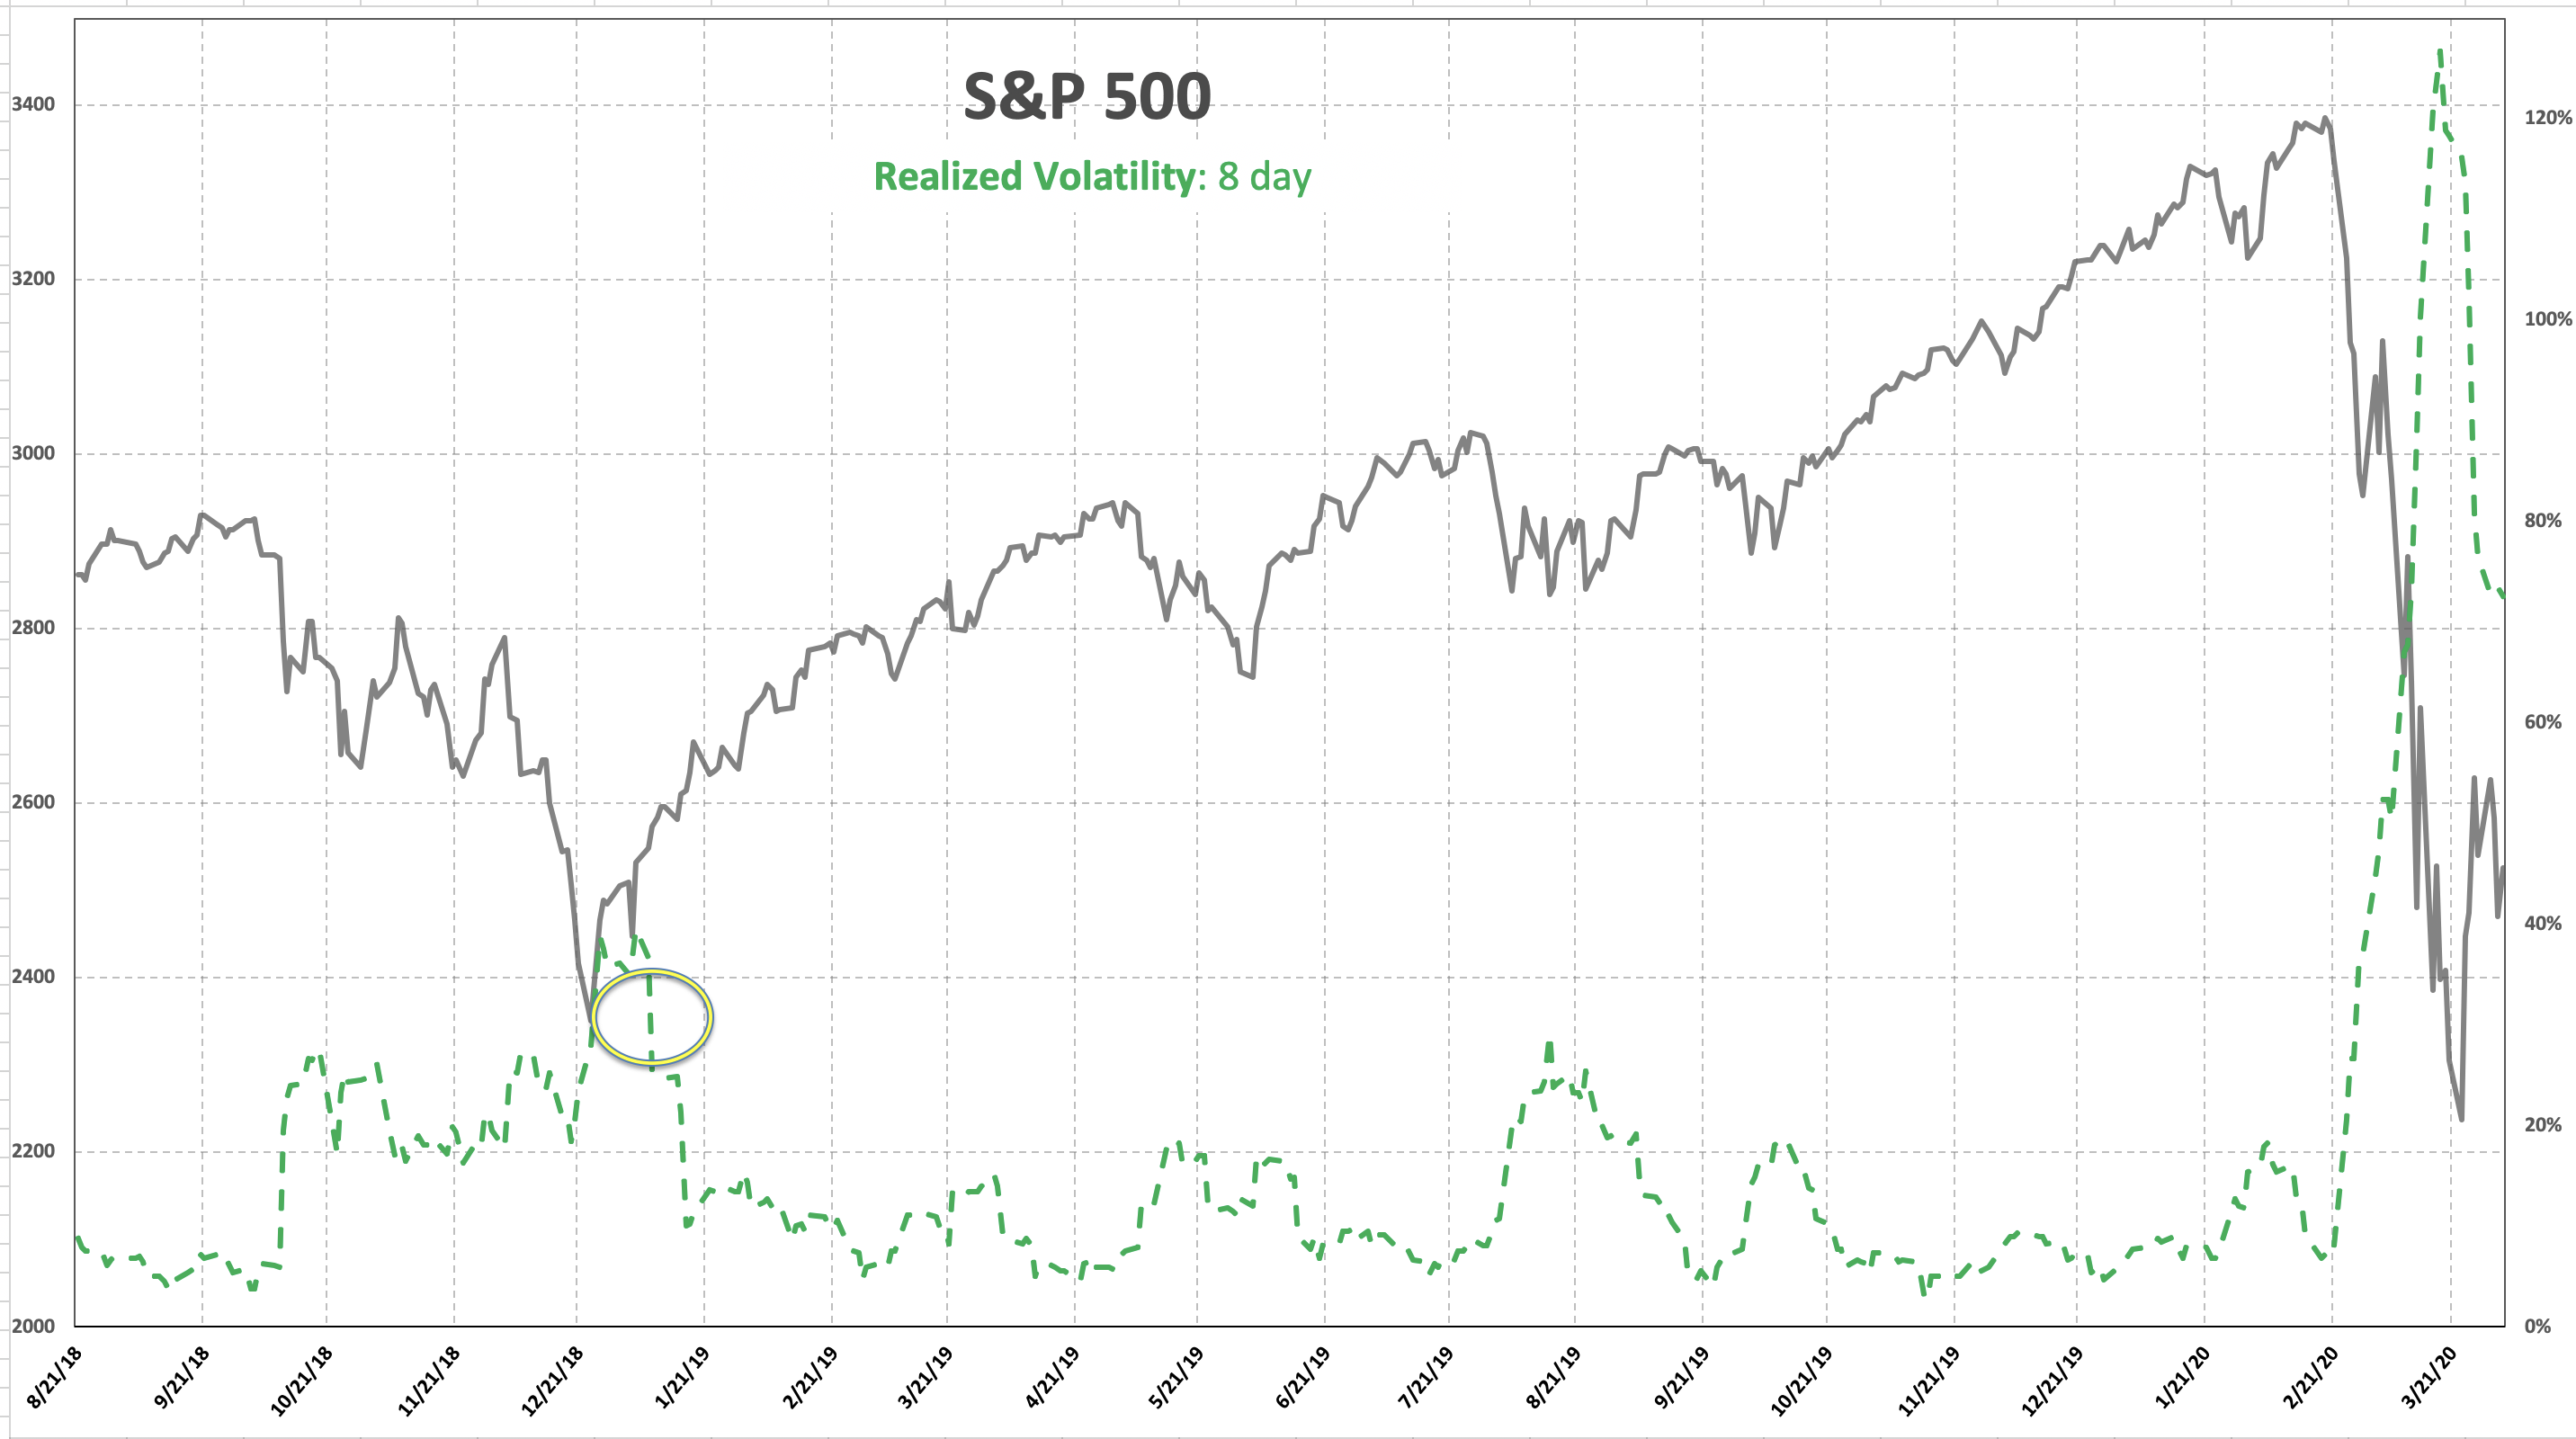
then Today...i even stretched the chart to show you Mathematically how different Q4 2018 was...Realized vol on an 8 day basis Barely got above 40% and was for a day....then came right back down hard.....
if you go to far right...very different picture today...its much more like 2008...that will take a long time to cool down and come back below 40% and then ultimately 20%.....till then...im in no disillusioned state that we have our selves a bottom bottom....