Rangebound Between 2775 Support and 2966 Resistance
 By
By
It was a whipsaw week that ended slightly down over the week. Neither the bulls or bears could take complete control over the week and things ended up neutral more or less.
On review of our data today, everything continues to look neutral. There's a breakout possibility in the beginning of the week and breakdown possibility in the latter part before recovering to close just below the 2900 area. Looking at all the available information, my read is that we will continue to trade rangebound with a possible bullish bias over the next few days, but until we take out the 2966 resistance area, this rangebound trading will most likely eventually resolve downward for a lower low below 2775 by around the first week of September.
If we do manage to somehow get above the 2966 resistance, the bullish train should resume back to 3100-3200 levels and higher, but this is not my preferred outcome right now.
ES Grey Zone areas: The grey zones on the ES 5 min chart below are what I draw in on a discretionary basis - they are supports and resistance areas which the market is most likely to react from. If we test a zone from below, it is likely to be rejected and fall lower to test support zones below. If we test a zone from above, it is likely to take support there and begin a move higher. So these zones can be used for intraday trading and/or as entry points for positioning for swing trades. These zones are drawn in based on what the market has done there previously both on smaller and larger timeframes.
Grey zone support now at 2857-64, then 2833-25. Resistance zone at 2892-2900 and then 2933-41.
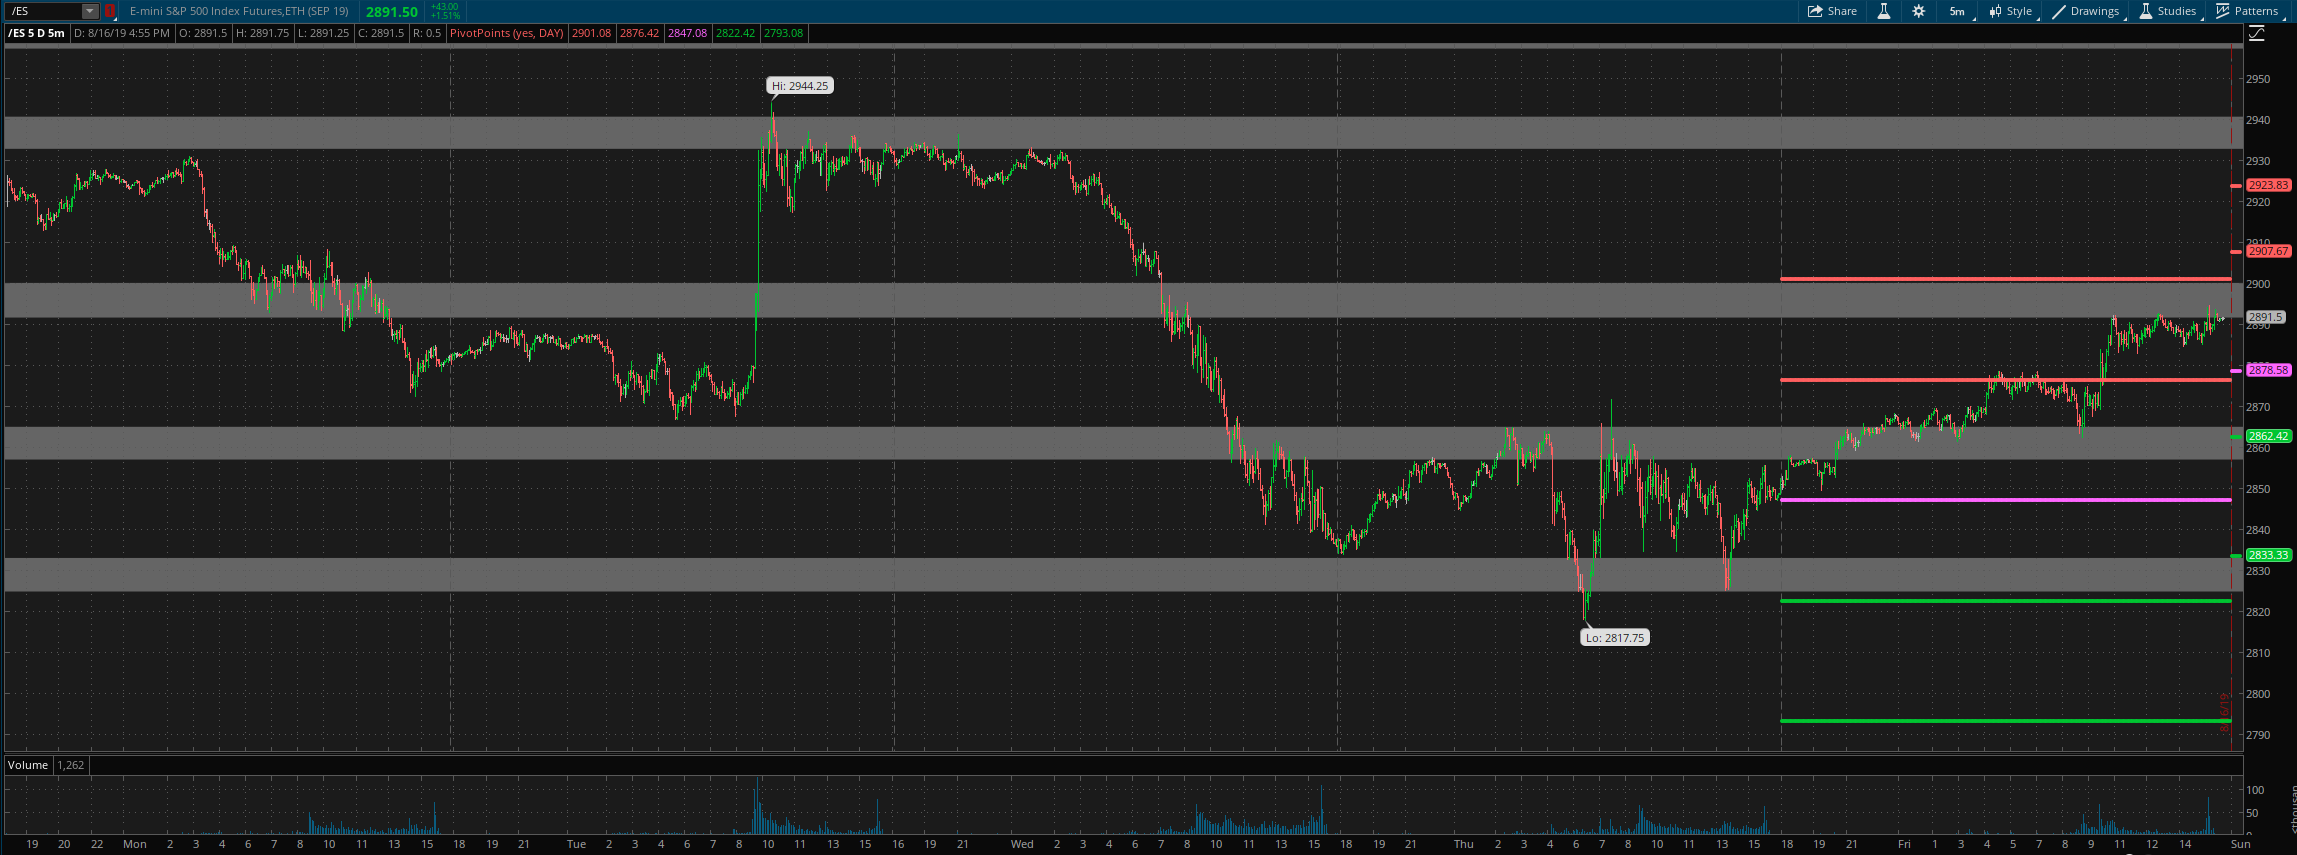
For Monday daily pivot is at 2878.5. Resistance R1 is at 2908 and R2 at 2924. Support S1 is at 2862 and S2 at 2833.
All the best to your trading week ahead.
