RUT in Final Stages of Rally Off 2009 Low
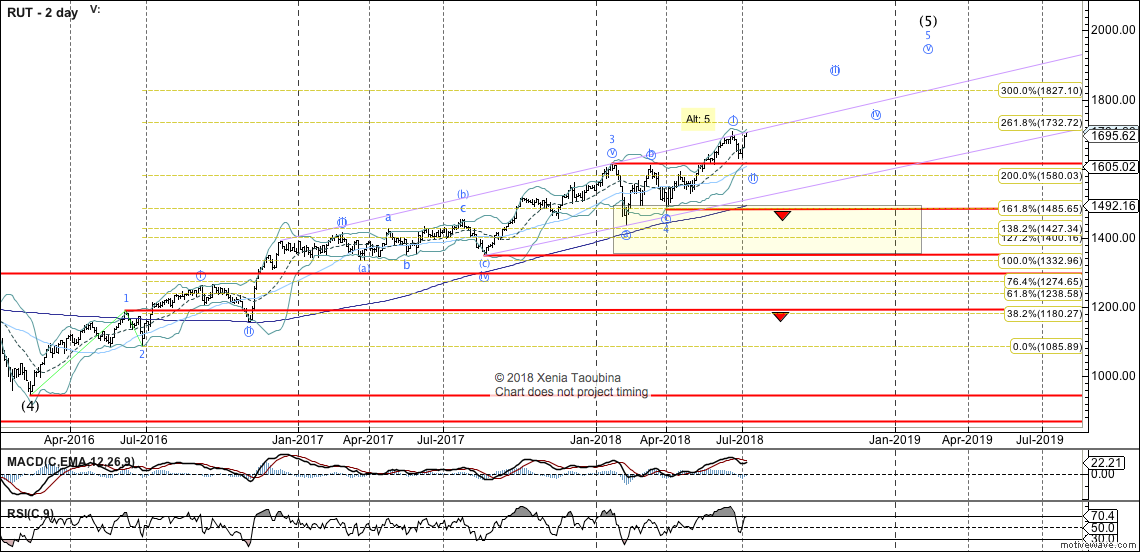
Looking at the very big picture, the weekly chart of the RUT suggests it's in the final stages of its rally off 2009 low, with potential that this structure already completed. Completion of the rally off the 2016 low will have me favor this entire move to have completed, though for as long as it's holding over 1100, there will be some potential that this rally will subdivide with one more high. Below 1100, next support zone is 829-979; ultimately, potential for a deep re-test of 2009 low (343) exists.
Moving on to the daily chart, RUT fulfilled the upside price target I set out for it in my post on February 11, 2016. It is now likely that the April low (1482) was the bottom of wave 4. A bearish interpretation is that the 5-wave move off that low is all of wave 5, with this interpretation becoming favored with a break of the April low. Until then, the potential exists that the move will subdivide higher, under either of the counts discussed in the paragraph below.
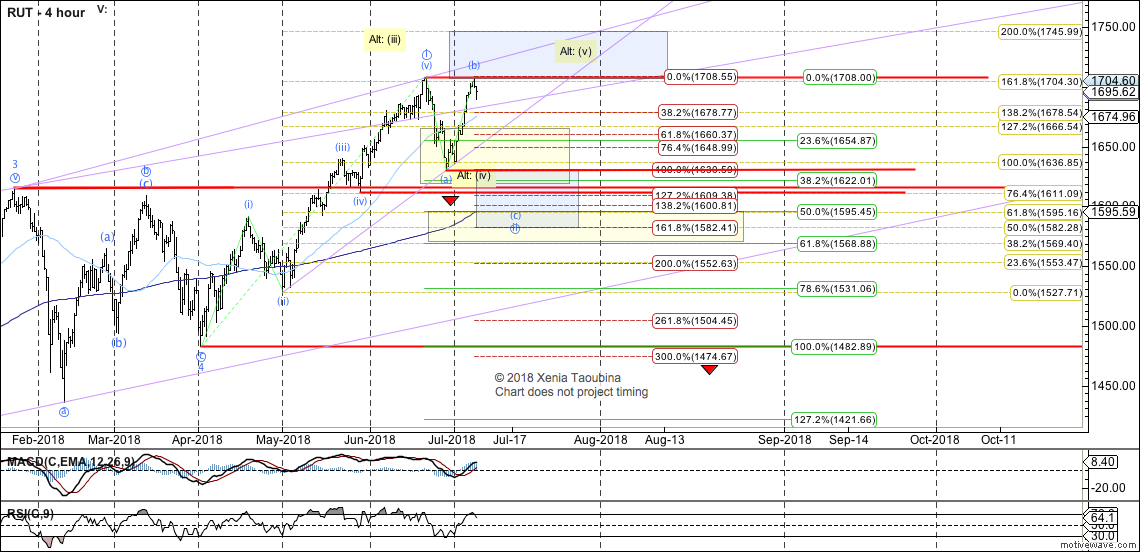
Zooming in further (intraday chart), I am viewing the decline off the June top as an impulse, suggesting that downside continuation is likely -- towards wave "(c)" labeled in blue on the 4-hour chart. However, for as long as 1611 is holding, the potential for RUT to make a new high remains, as is shown by the Alt count, with the expectation that such new high will not be a lasting breakout but rather will complete an impulse off April low, remaining under 1745 resistance.
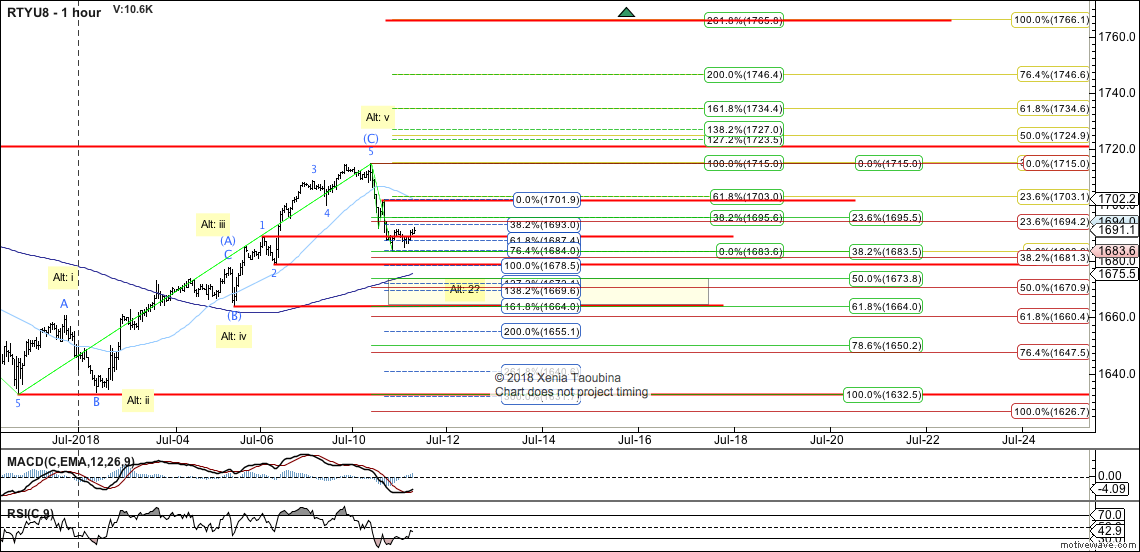
Zooming in further yet (RTY futures charts), yesterday RTY provided perfect completion of the primary pattern that I've been following, and promptly reversed down. At this time, downside is sufficiently large to make the prior Alt count unlikely. It is, however, possible to view the structure as a potential 5-up with an extended wave v, so the most bullish interpretation is that RTY is working on a 1-2 off June 28 low (labeled as Alt).
While I consider such interpretation unlikely at this time, it will become reasonably probable IF RTY is able to break over yesterday's high (1715.0), and becomes likely with a break of the solid yellow 1.0 extension.
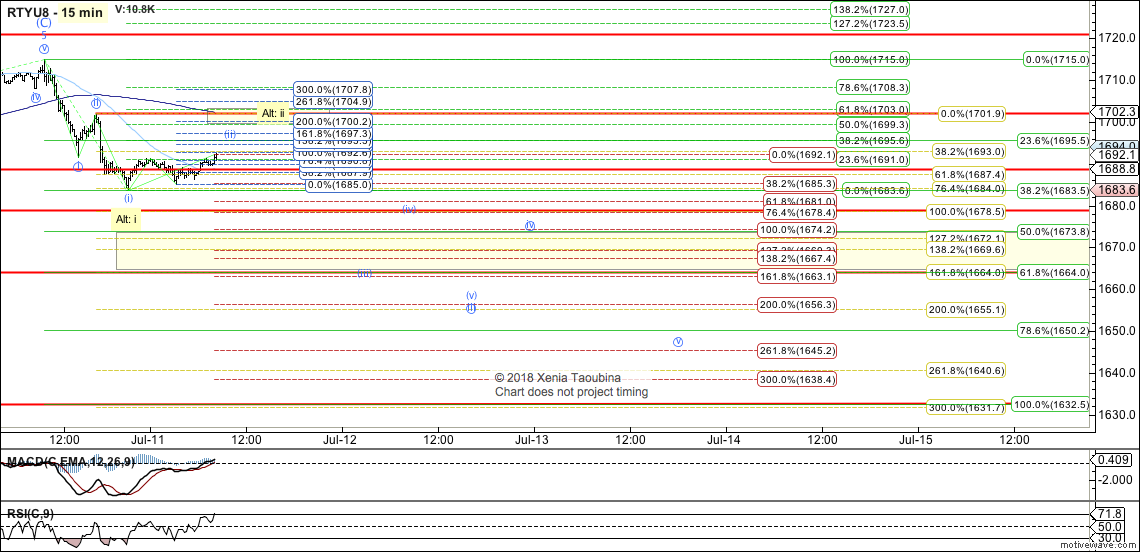
On a micro level (15min chart), I noted yesterday that the decline off the top was best viewed as an impulse, so it's no surprise that downside continuation was seen overnight. At this time, it's not clear whether RTY is already in wave circle-iii (labeled as primary), or if the overnight downside continuation is just an extension of circle-i, with a larger bounce yet to be seen (labeled as Alt). A re-test of the afternoon bounce high (1701.9) is needed to favor the Alt count. Under both counts, lower is favored, and the difference is in the extent of the intervening bounce.