RUT Continues to Deliver on Bearish Perspective
The Russell 2000 (RUT) continued to deliver on my bearish perspective, first voiced in the free article series on Oct 3 with RUT at 1671, and discussed with subscribers prior to that. A break below 1436 made it likely that rally off 2016 low completed, and with it, opening up potential to completion of the entire rally off the 2009 low.
To make completion at that degree likely, RUT needs to break below 1127; until then, potential for this decline to be wave (4) in the rally off 2009 low exists (Alt count on the 2-week chart). For the Alt count to be favored, however, RUT needs to rally over 1586.
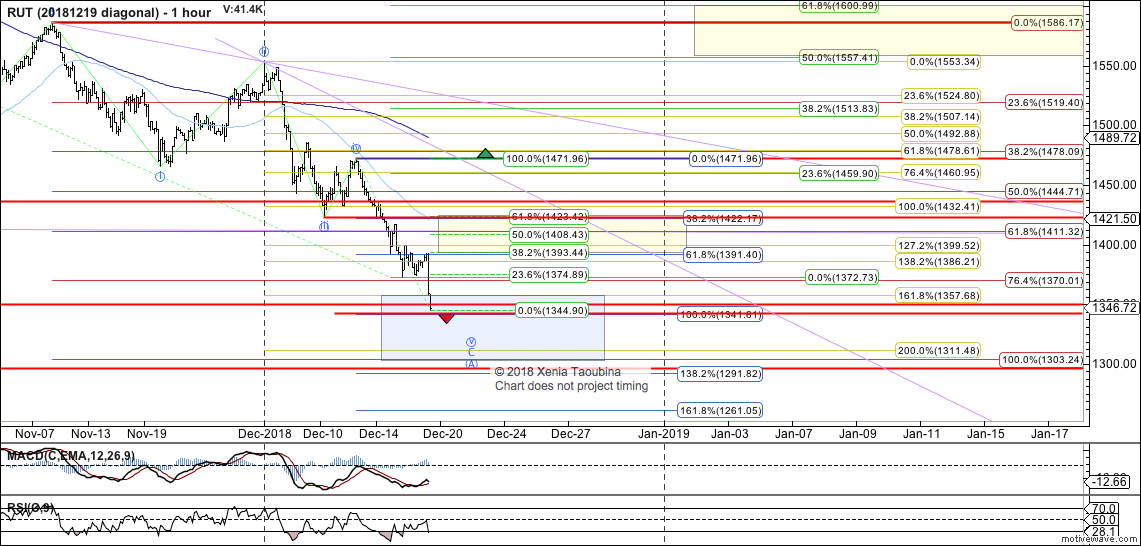
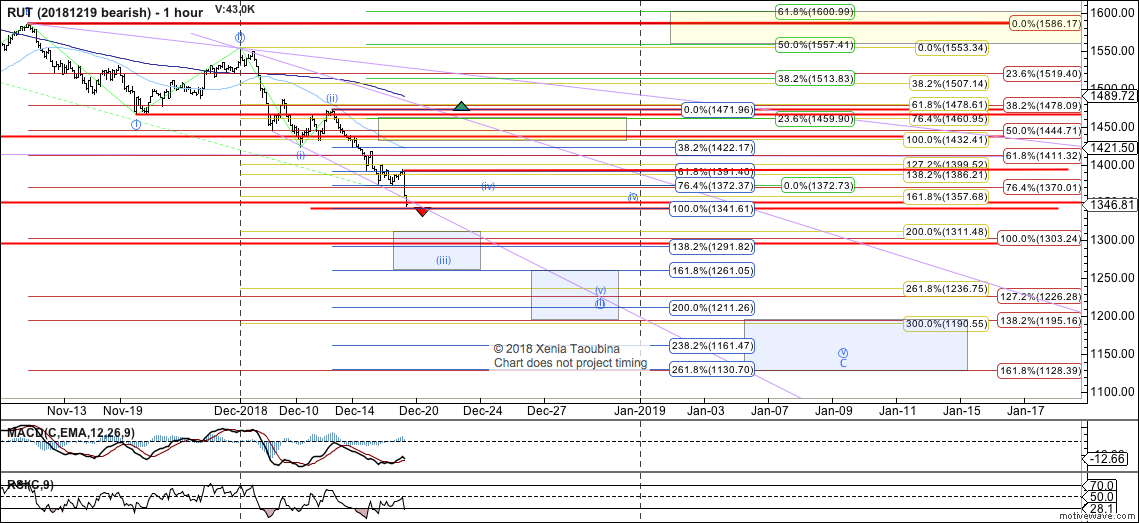
Zooming in (RUT intraday charts), RUT once again finds itself at a crossroads. It can be viewed as completing a diagonal wave C down (shown on the "diagonal" chart), or as being in the midst of an accelerated breakdown (shown on the "bearish" chart). Absolute minimum needed to favor a short-term bottom here is a rally over 1393, with stronger indication over 1472. Until RUT is able to reclaim 1393, a direct path to 1128-1195 exists, per "bearish" chart.
IF RUT is able to reclaim 1393, diagonal count will be favored, with Alt at that time being that such diagonal was only wave i of C rather than all of C. Bottom line, while potential for a local bottom over 1303 exists, it will take a break over 1586 to favor such local bottom to be all of the correction.
Click here for the 2-week RUT chart. Intraday charts are below.