Projected Topping Zone Reached
 By
By
As I wrote in last weekend's report: "My read based on the info available is that we are going to hit somewhere in the 2850-2900 zone before we begin a bigger pullback. I think all of this is a big B wave with at least a retest of the lows to come - but I am open to a higher low as well. The coming week is OPEX week so it is a good week from a timing perspective for a high either in the coming week or the week after. And the move afterward will tell us a lot what to expect in the bigger picture."
What actually happened: We hit the 2850-2900 zone in the S&P 500 as projected.
What next?
The 2850-2900 zone we reached last week is an area I've had as a projected topping zone before a bigger pullback or more. No change in the viewpoint right now. However, I will note that options data looks bullish and internals data does not look that bad either. I am open to something more bullish developing over here, but I think this area around 2900 is very strong resistance and it makes sense for a pullback or more to develop from right around here. How low? Cannot really say, but I like 2500 area at the very least but possibly a retest of THE lows/slightly lower lows. For now, though, this is all speculation. We have been long in the Smart Money room for almost three weeks, and our QQQ position is up 16%. The ES longs for those who took them are up more than 400 points. We will continue to hold and maintain a long bias until our indicators and system tells us to go flat or short, because right now the path of least resistance is still UP.
If interested to read more about the trading/systems that we use in the Smart Money room, see this post and the links within: https://www.elliottwavetrader.net/members/atchat/?threadId=5940210
ES Grey Zone areas: The grey zones on the ES 5 min chart below are what I draw in on a discretionary basis -- they are support and resistance areas which the market is most likely to react from. If we test a zone from below, it is likely to be rejected and fall lower to test support zones below. If we test a zone from above, it is likely to take support there and begin a move higher. So these zones can be used for intraday trading and/or as entry points for positioning for swing trades. These zones are drawn in based on what the market has done there previously both on smaller and larger timeframes.
Grey zone resistance is at 2883-2904. Support is at 2844-22 and then at 2758-44 area.
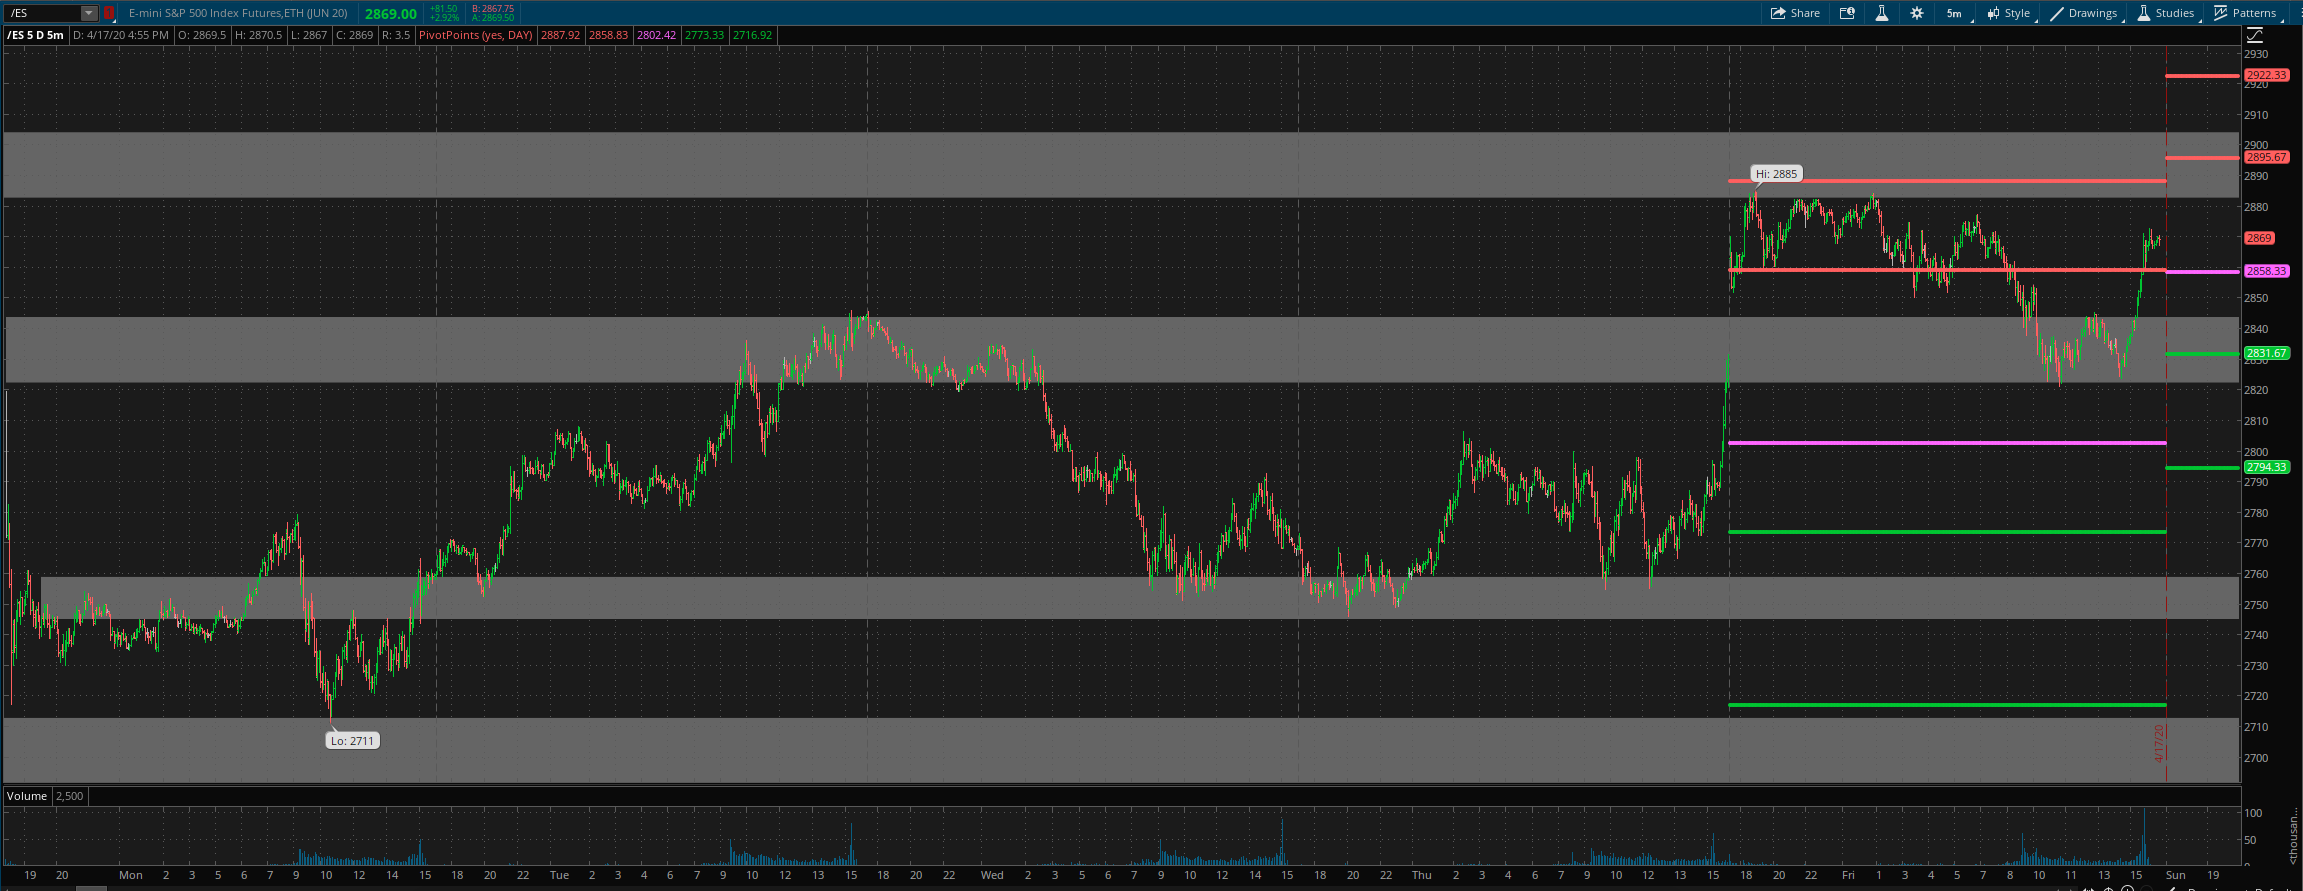
Daily pivot is at 2858. Resistance R1 is at 2896 and R2 at 2922 Support S1 is at 2831.5 and S2 at 2794.
All the best to your trading week ahead.
