Profit-Taking As Micro Signals Move to Sell
 By
By
In last weekend's report we wrote: "Until price breaks some supports, the path of least resistance is higher. I do think we are nearing an area where a more significant top can form but next week is OPEX week and even if we do have some downside soon, it is likely to happen only after monthly opex is out of the way. So, for now, while I do think it is time to be cautious and be on the lookout for bears to step up soon, the path of least resistance is still higher - so we continue to hold longs and wait for the micro1 indicator to actually give us a sell signal before exiting them."
What actually happened is that we hit the high of the week on Wednesday and from there broke down to end up in a relative bearish OPEX. Internals did give us a lot of warnings during the week and we exited our longs with some excellent profits before the market broke lower.
What next?
I thought the market would hold up until OPEX was out of the way, but we were not able to do that. Internals were giving us warnings throughout the week, and I was posting that the rally was running on fumes. Our micro1 signal went to sell early in the week and we booked our QLD longs for 6.6% profit. Right now, some of our shorter term models are on sells and some are on buys. We are neutral the market and based on options data this weekend, it looks like we might have some bounce and/or choppy action ahead before more downside. I see the 3300 area on the Emini S&P 500 (ES) as important support and if this is broken, we should visit the 3240/3210 area next. My gut feel right now on the market is that this correction can last for longer and deeper than most expect. BUT…as usual, we do not have to overthink this; we just wait for the next micro1 buy signal to trigger and when it does, take a fresh long position. Rinse and repeat.
ES Grey Zone areas: The grey zones on the ES 5-min chart below are what I draw in on a discretionary basis -- they are support and resistance areas which the market is most likely to react from. If we test a zone from below, it is likely to be rejected and fall lower to test support zones below. If we test a zone from above, it is likely to take support there and begin a move higher. So these zones can be used for intraday trading and/or as entry points for positioning for swing trades. These zones are drawn in based on what the market has done there previously both on smaller and larger timeframes.
Grey zone resistance at at 3338-45 and 3391-98. Support is at 3310-03 and then at 3270-63 area.
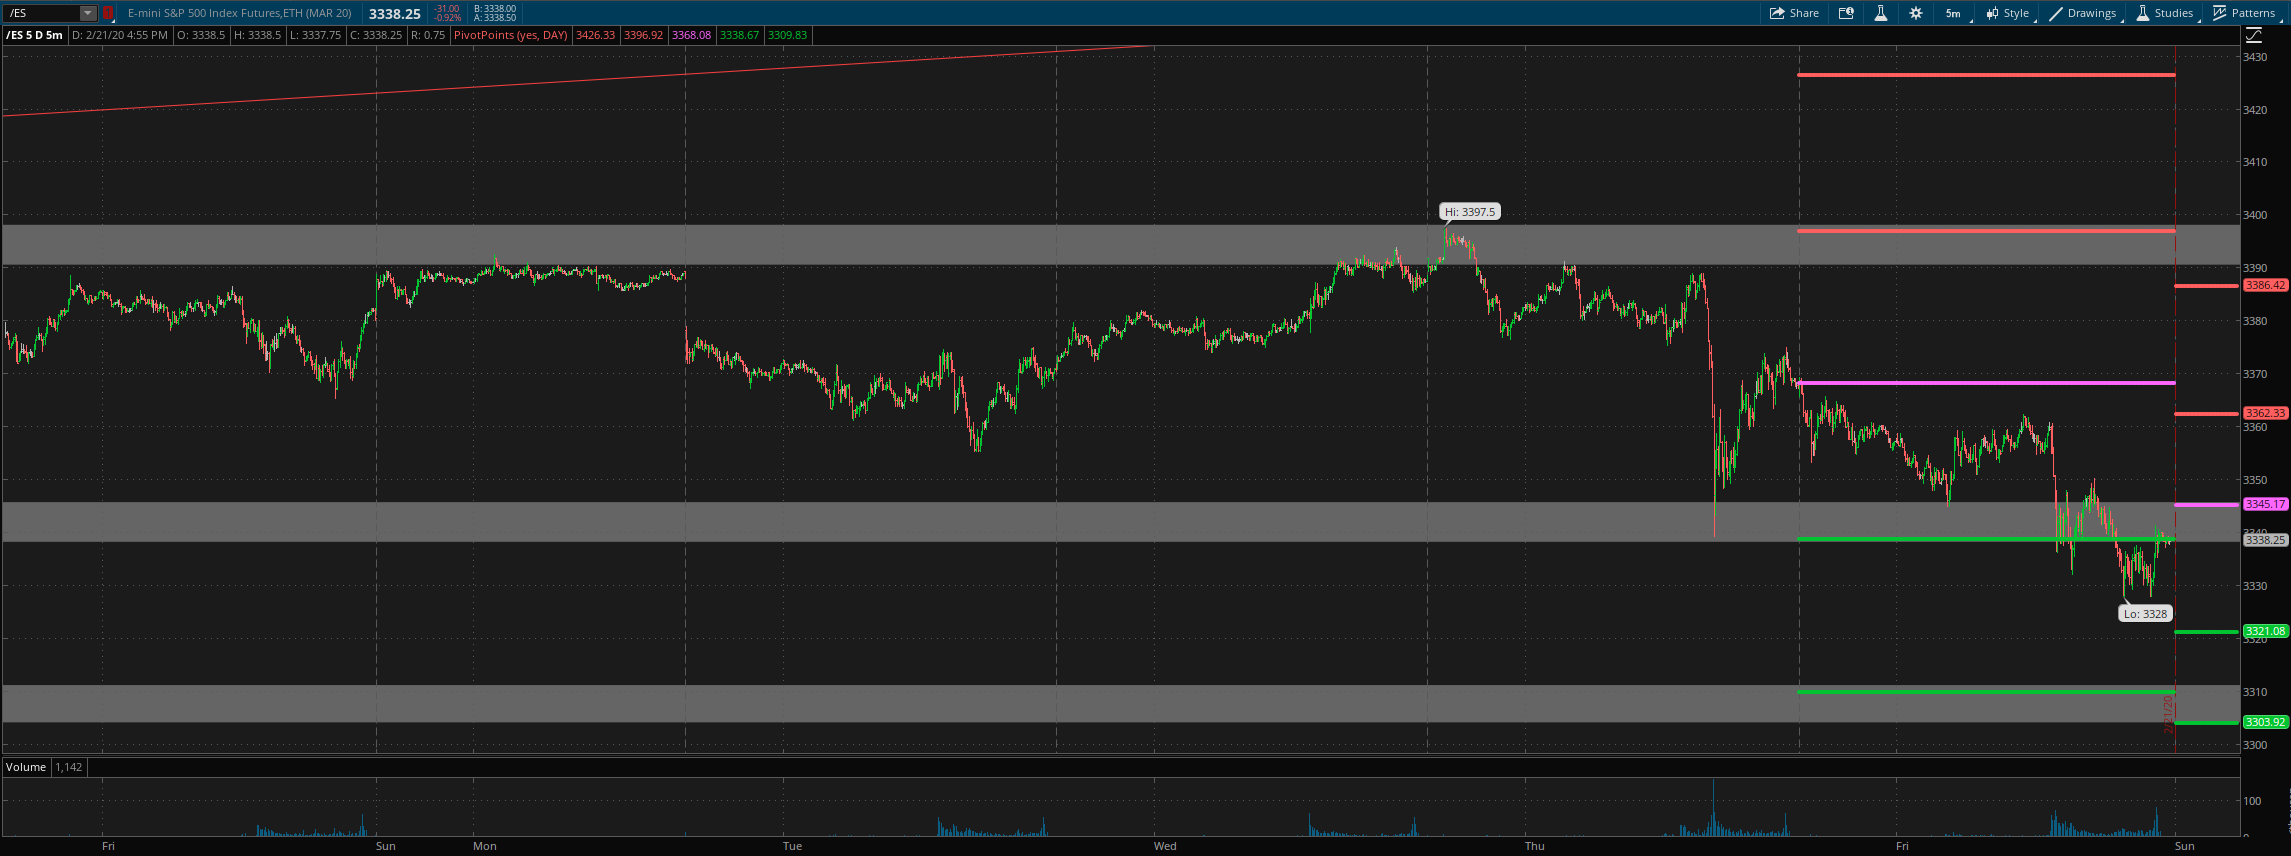
Daily pivot is at 3345. Resistance R1 is at 3362 and R2 at 3386. Support S1 is at 3321 and S2 at 3304.
All the best to your trading week ahead.
