Price Action Looks Bullish
 By
By
The market saw a little weakness on Monday and then a strong run higher for the rest of the week. Internals look good. While the shortest timeframe went to a sell, that could still be a whipsaw. All other timeframes remains on buy signals.
Our Odds Indicator remains on a buy. Put/call ratios continue to look extreme but are now suggesting we might have more upside ahead before a correction. Price action looks very bullish -- a strong grind higher with minor pauses to refresh.
While everything looks bullish, we are nearing an area in price where some supply can come into the market and so some corrective action can be expected very soon. Big picture, I think we have some more upside toward 4600 area and then a bigger correction toward 4400/4300 into the fall timeframe. Short term I think there's some chop/consolidation ahead followed by a push higher toward 4600 area.
Price action is bullish short term, bullish medium term and bullish long term.
Grey zone resistance is at 4552-59 and then in the 4590 area. Support is at 4533-24, 4500/4492 and 4474-67.
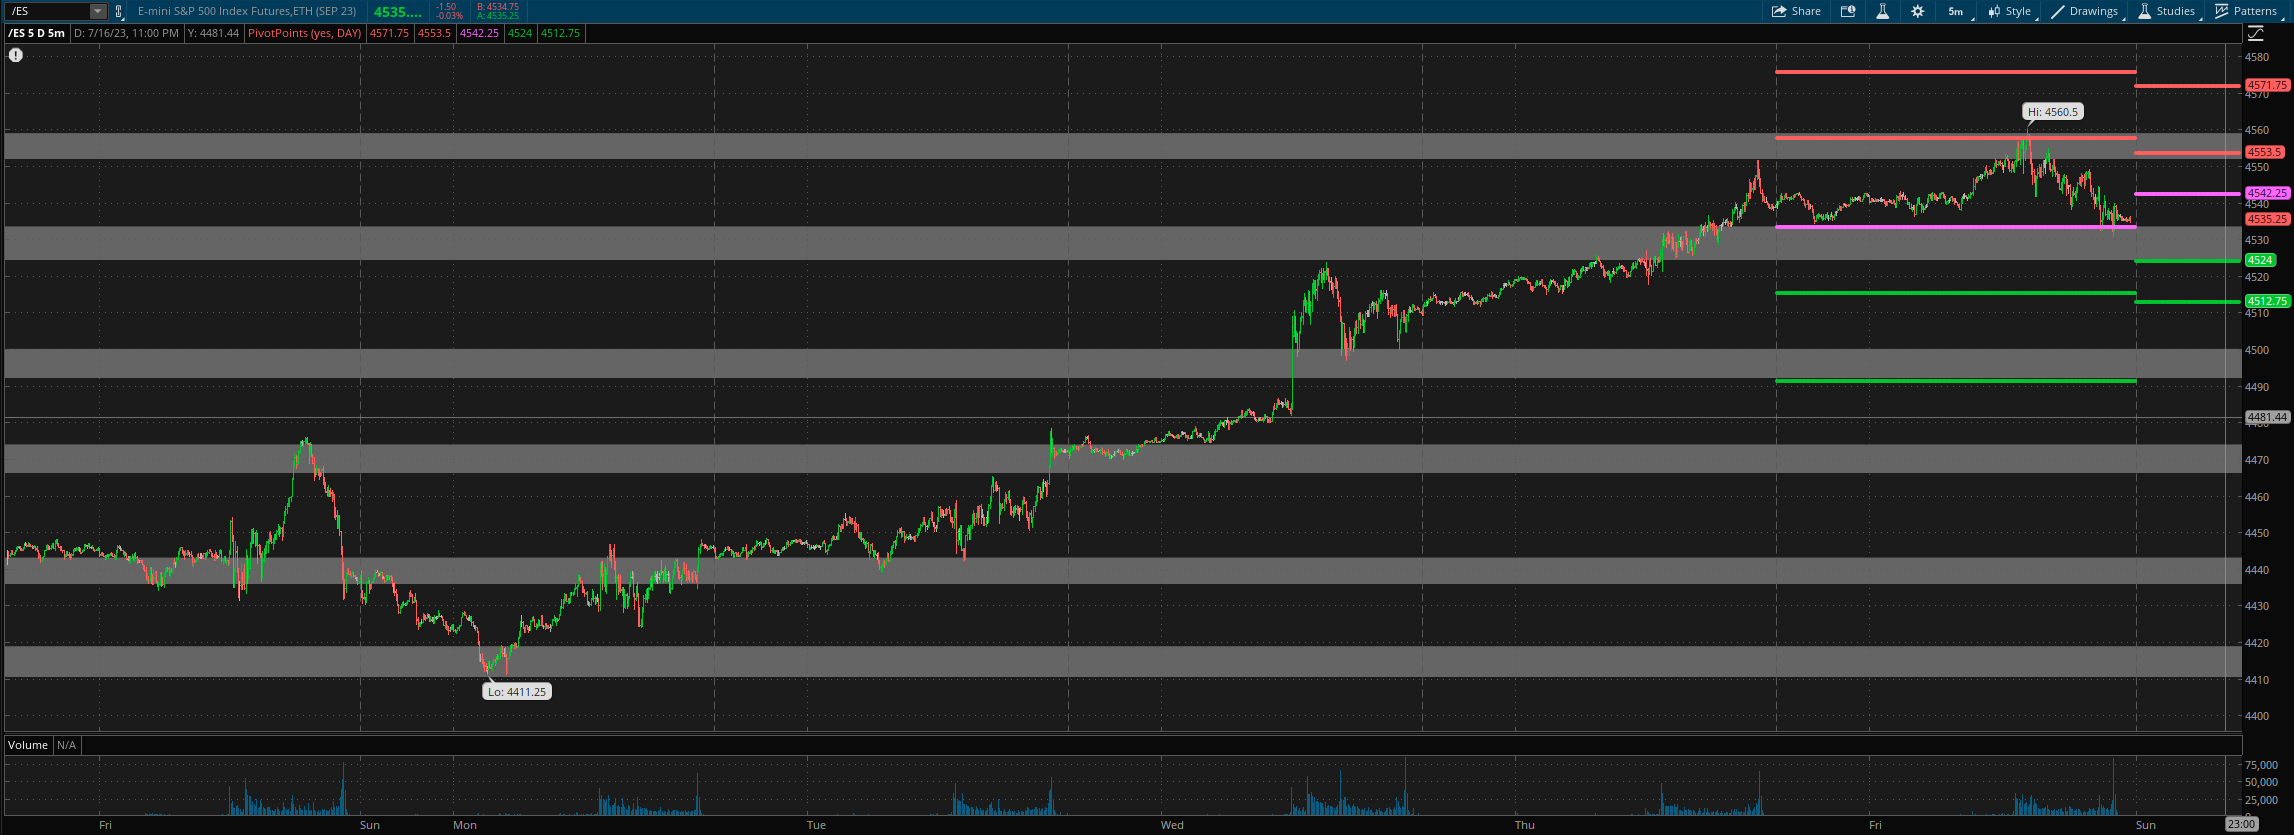
For Monday, daily pivot is at 4542. Resistance R1 is at 4553.5 and R2 at 4572. Support S1 is at 4524 and S2 at 4513.
