Preparing For A Pivot Lower At Resistance
 By
By
In last weekend's report we noted that a successful test of support last week would lead to a breakout over 3230 area in the Emini S&P 500 (ES), which should get us up to the 3300 area next. What actually happened is we did get the successful breakout above 3230 and test of 3285 area before giving up all the gains to end the week flat.
Going into this coming week, the internals are slightly bullish. Options are also slightly bullish to neutral. Price action short-term is bearish, and medium-term is neutral/balancing within a range.
Looking at price action, we are clearly getting supply at higher levels and this is telling me that we need to be on the lookout for a bigger correction in price to materialize sooner rather than later. My view right now is that price can have a bounce into the 3250 area early in the week, and if that resistance area holds we should begin another leg lower. Our composite signal is still on a buy, but it looks to me like odds will stop supporting the long trade very soon and may shift to the short side. If it does this, we will be looking for a short signal to set up on our indicators before trading the short side. And I think this can also happen in the coming week. Remember that this is just speculation for now and we are still long based on what our indicators and signals are saying at the moment, but at the same time be alert for a change in the next few days.
Here are our grey zones on the ES 5-min chart, which are support and resistance areas which the market is most likely to react from. Grey zone resistance is at 3226-39 and then at 3274-84. Support is at 3200-3190, 3163-3159 and then at 3120-3108.
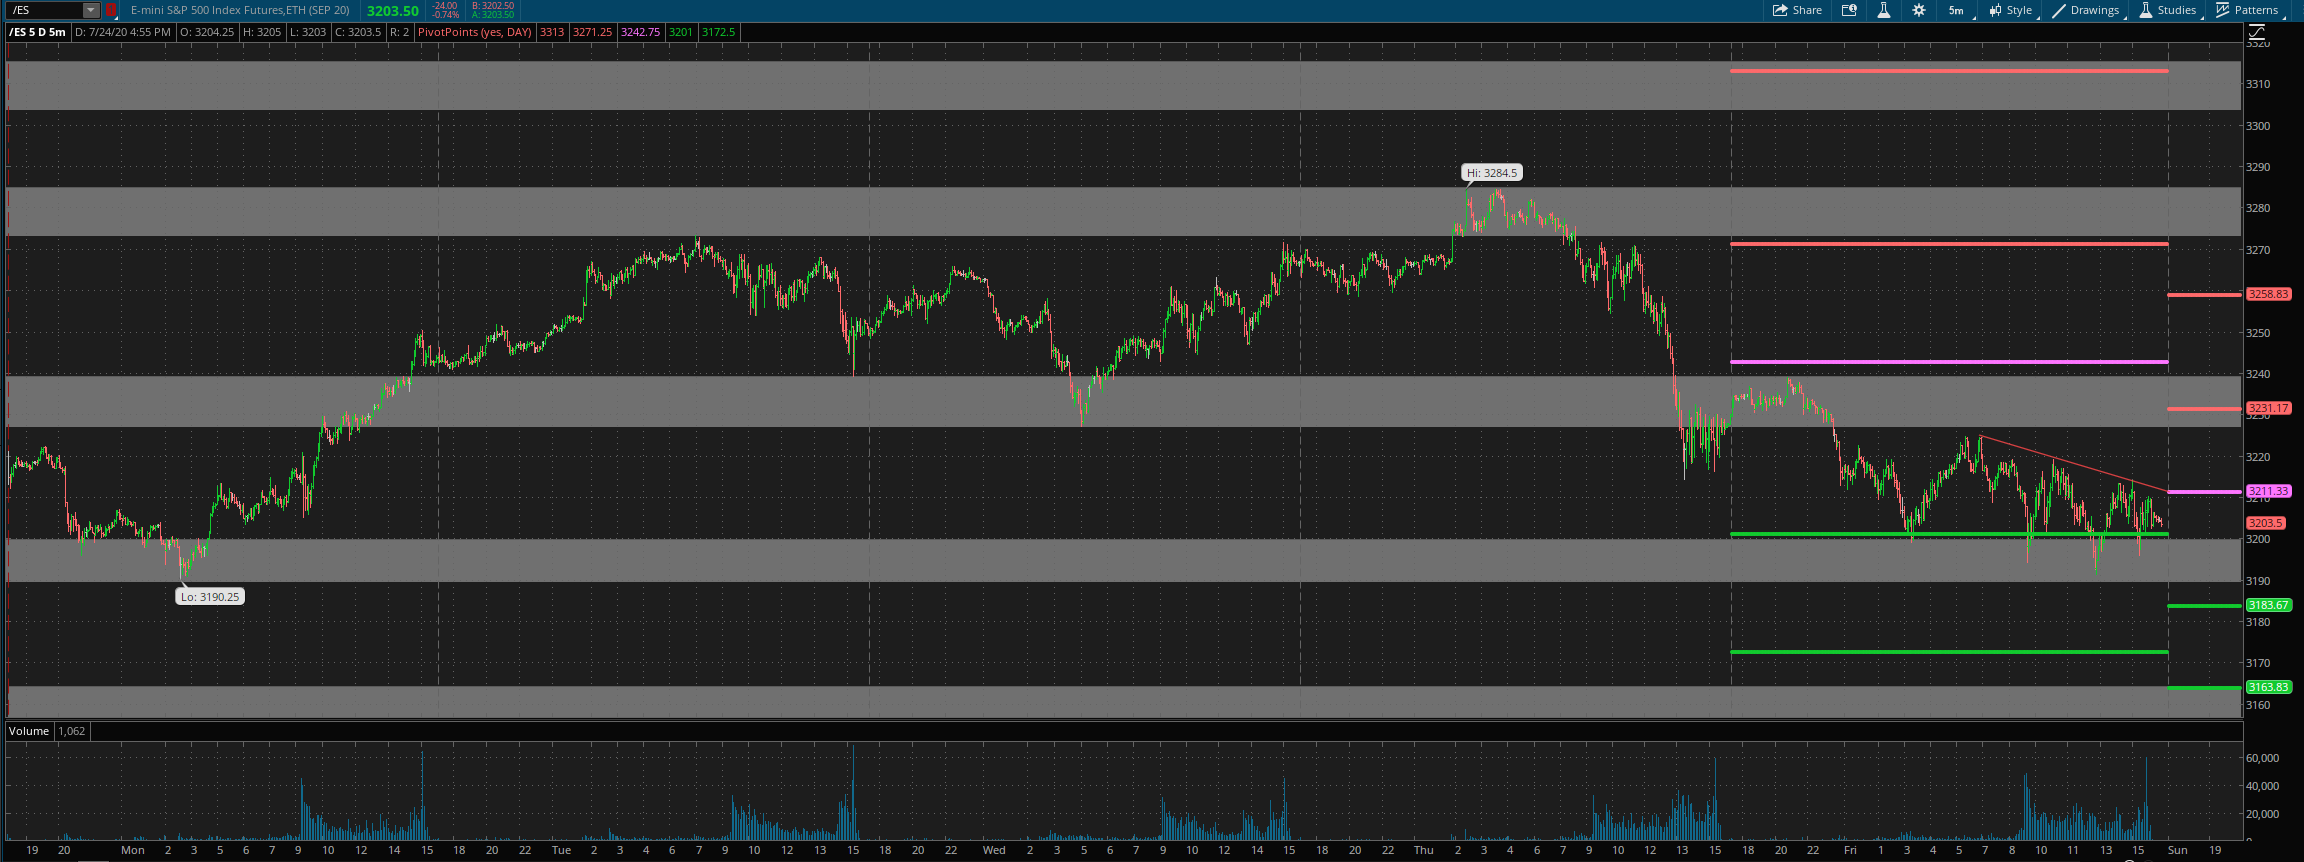
For Monday, daily pivot is at 3211. Resistance R1 is at 3231 and R2 at 3259. Support S1 is at 3183.5 and S2 at 3164.
All the best to your trading week ahead.
