Positioning Along Path Of Least Resistance
 By
By
I noted in my weekend update last Sunday that I expected a rally in the 3040's last week, and the S&P 500 did that and more. What's next?
In that update I wrote: "Same as last week, most of our models continue to be on buy signals. Option open interest models also suggests continued short-term strength although on the longer term, some warning signs are popping up. We will continue to use the NYHL1M and the micros to position on the correct side of the market -- meaning the path of least resistance -- which is up for now. Upside immediate resistance is at 3022-27 and above this 3042-46. On the downside, support comes at 3010-3014 and below this most important support is at 2983-75. Below this support zone is required to confirm some kind of top in the market. Based on the razzmatazz waves, my expectation is for the market to continue on the path of least resistance into the 3040s in the coming week and depending on how we act in that area, we can determine next possible paths in the market."
What actually happened: The S&P 500 moved higher during the week into the 3050 area, backtested support and ended the week at 3063.
What's next? Most of our models continue on buy signals. Micro1 went through a one day whipsaw, but ended on a buy again to close the week. The options data, however, continues to look quite bearish, and with the SGPCR getting close to the 2.2 levels, we have to be on the lookout for something more bearish developing. Price is however king as I have been saying, and that is still moving higher. For bears to get anything lasting on the downside, the first level to break is 3020 on ES.
This coming week is the week before options expirations week and we usually have some kind of correction into WWW -- that is the Wednesday of the week before options expiration week. So let us look for something similar to happen this time as well -- maybe a pop on Monday into the 3080 area followed by a pullback into Wednesday/Thursday, which then sets up a move higher into monthly OPEX. Regardless of how this plays out, we will use the NYHL1M and the micro signals to guide us in our positioning along the path of least resistance, which for now is still Up.
ES Grey Zone areas: The grey zones on the ES 5 min chart below are what I draw in on a discretionary basis. They are support and resistance areas which the market is most likely to react from. If we test a zone from below, it is likely to be rejected and fall lower to test support zones below. If we test a zone from above, it is likely to take support there and begin a move higher. So these zones can be used for intraday trading and/or as entry points for positioning for swing trades. These zones are drawn in based on what the market has done there previously both on smaller and larger timeframes.
Grey zone resistance at 3080-85. Support is at 3058-53, 3038-35 and then at 3025-20.
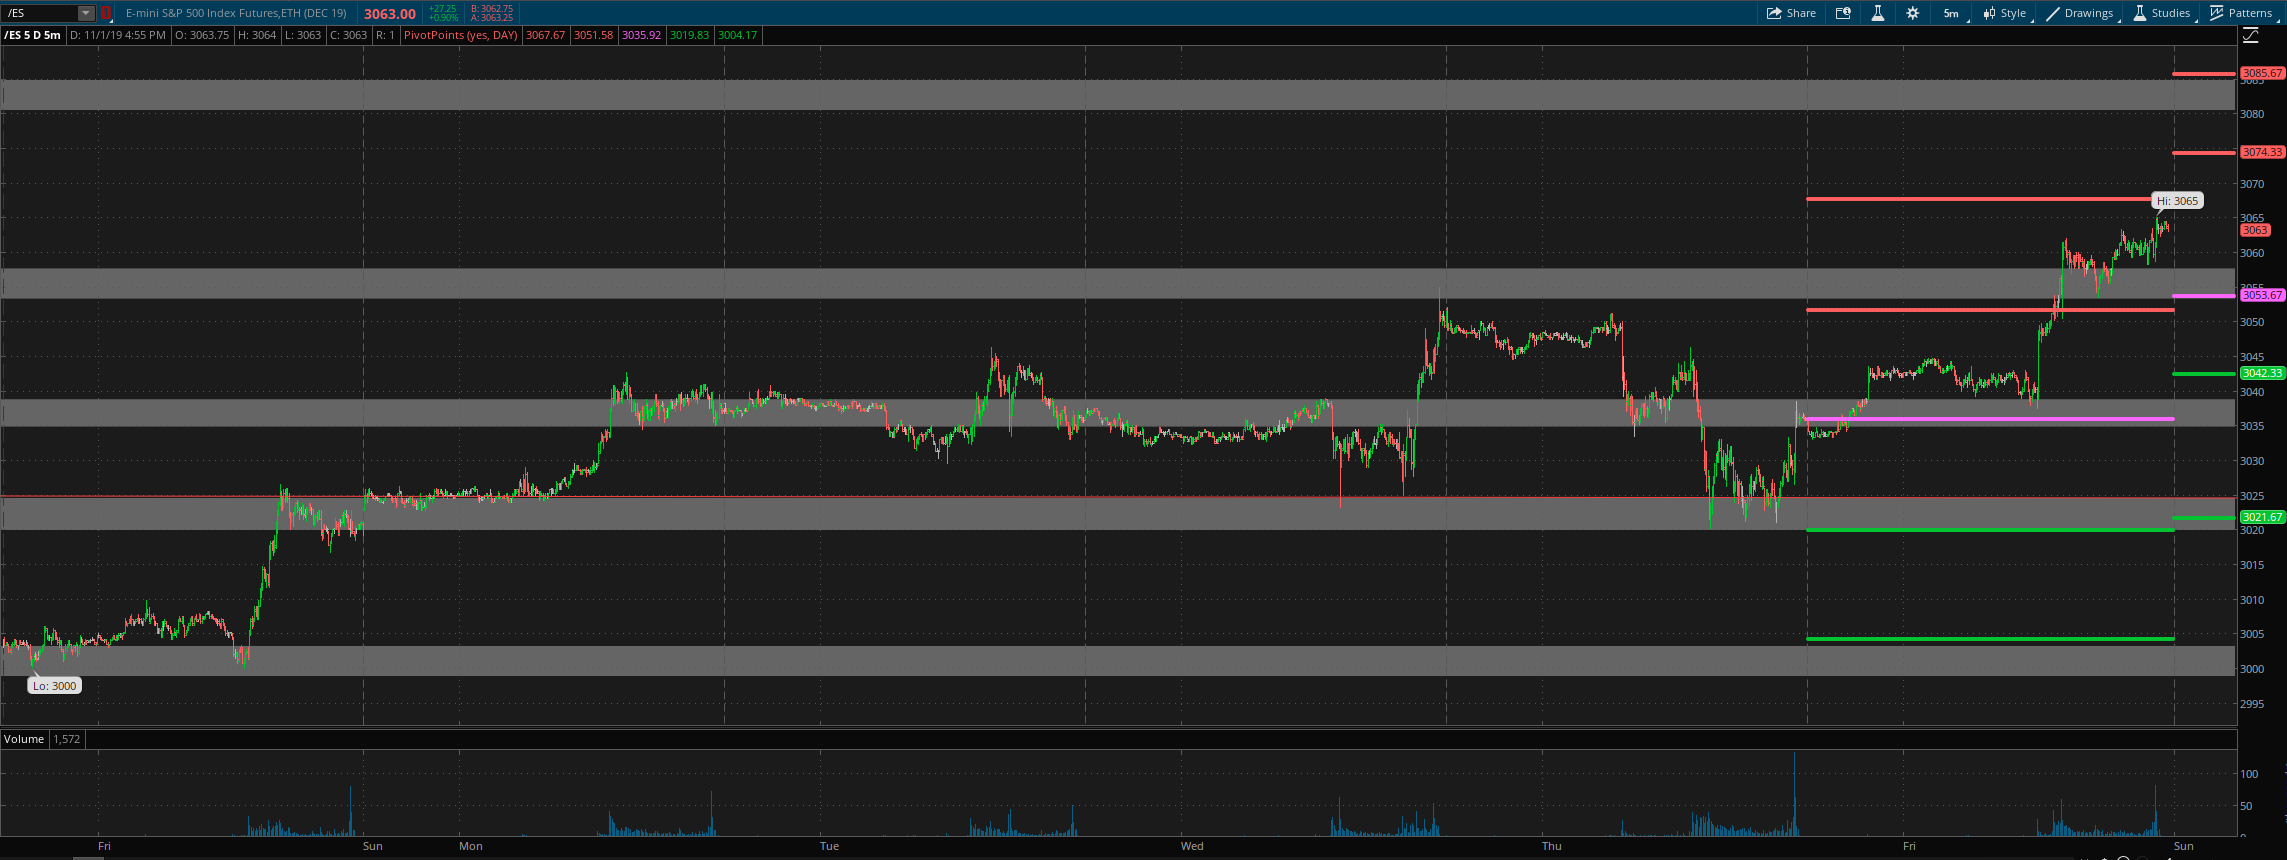
Daily pivot is at 3053.5. Resistance R1 is at 3074 and R2 at 3085.5. Support S1 is at 3042 and S2 at 3021.5.
All the best to your trading week ahead.
