Perfect WWW Action - Market Analysis for Apr 14th, 2019
 By
By
In our update last weekend, we wrote that our Smart Money models "remain on buy signals across the board."
We added, "OI suggests some weakness in the beginning of the week ahead. This also ties in nicely with historical norms of having a pullback on the week before monthly options expiration. This is known as WWW -- the Wednesday of the week before options expiration. My thought is that we get some weakness into Wednesday this week, set a low and then begin a move higher into Opex week -- i.e the week of April 18th. On price, we have reached 2900 round number territory where it is very likely for us to see some kind of pullback. This also suggests we see some weakness dead ahead. I also think that this weakness may just give bears some false hope in the very short term. Lasting weakness may only come after April Opex is out of the way."
We got exactly that: Weakness beginning of the week…. down into Tuesday/Wednesday… before recovering to close the week strong. Perfect WWW action.
What next?
The strength we saw last week is likely to carry on into this week at least in the beginning. And then we should see some topping action into OPEX on Thursday. 2915-20 is resistance. I expect us to clear this and make a run for the 2940-50 area which has high odds of being some kind of top. It will fit well for a top to form in that area sometime around monthly OPEX which is this coming Thursday. And for us to finally begin some kind of pullback from there. Remember however that this is just speculation for now and we should have no plans to completely exit our longs (maybe partially) or attempt shorts unless our mechanical models actually tell us to do so. Most market participants ignore what the market is doing right now and try to look at what it might do in the future often without any real reason except that it has gone too far in one direction.. our models tell us what is the path of least resistance right now and we position ourselves with it - this is what makes our indicators and models powerful and worth following.
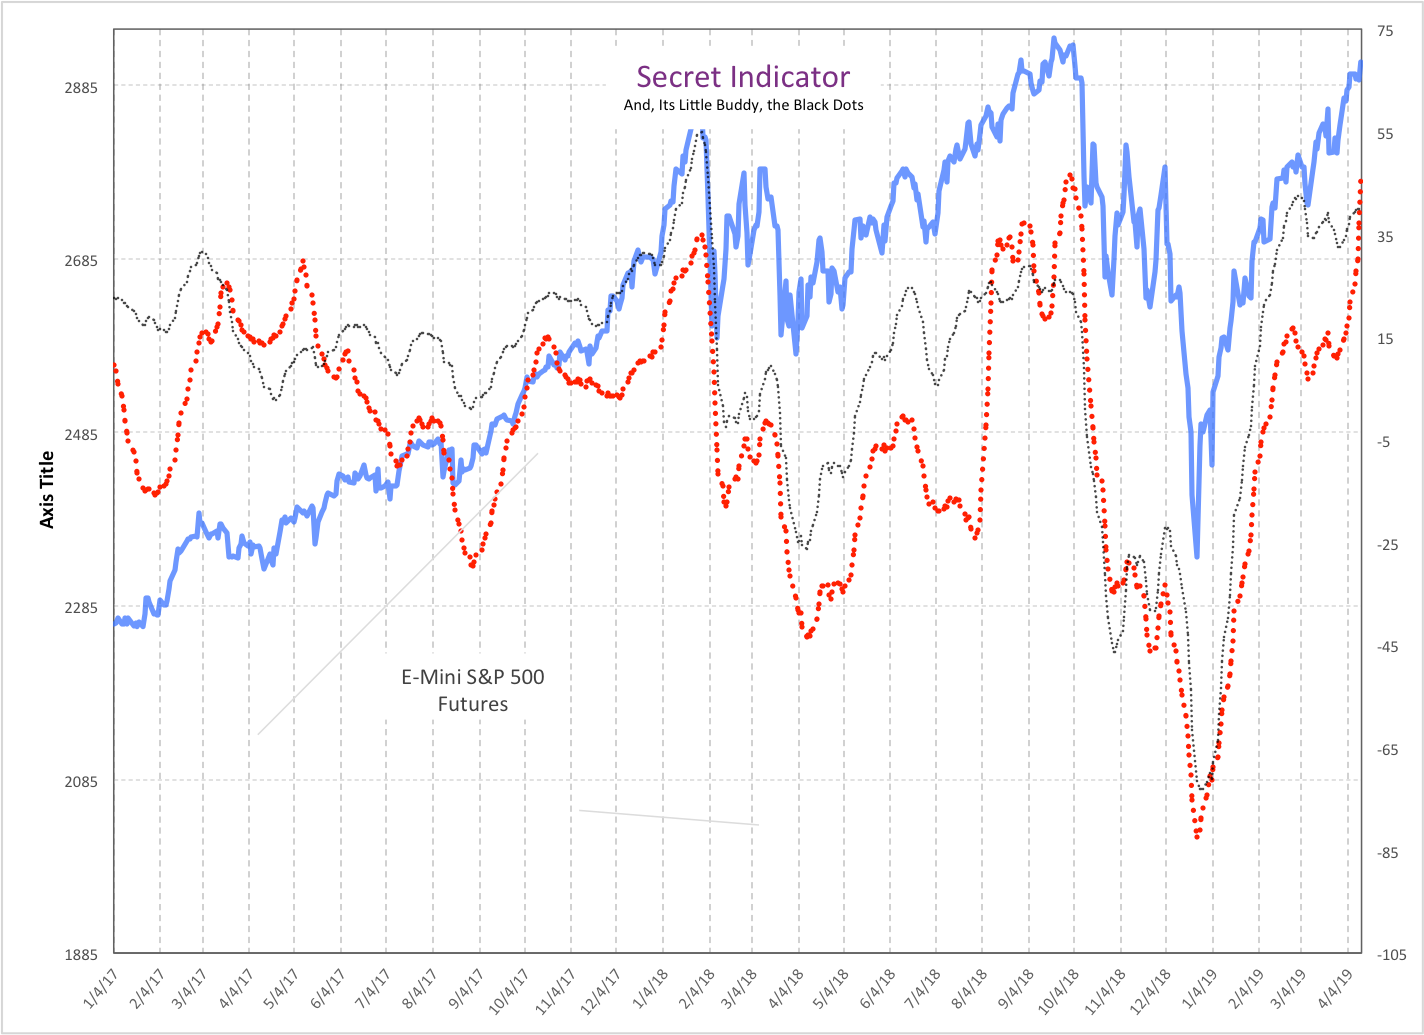
Secret Indicator:
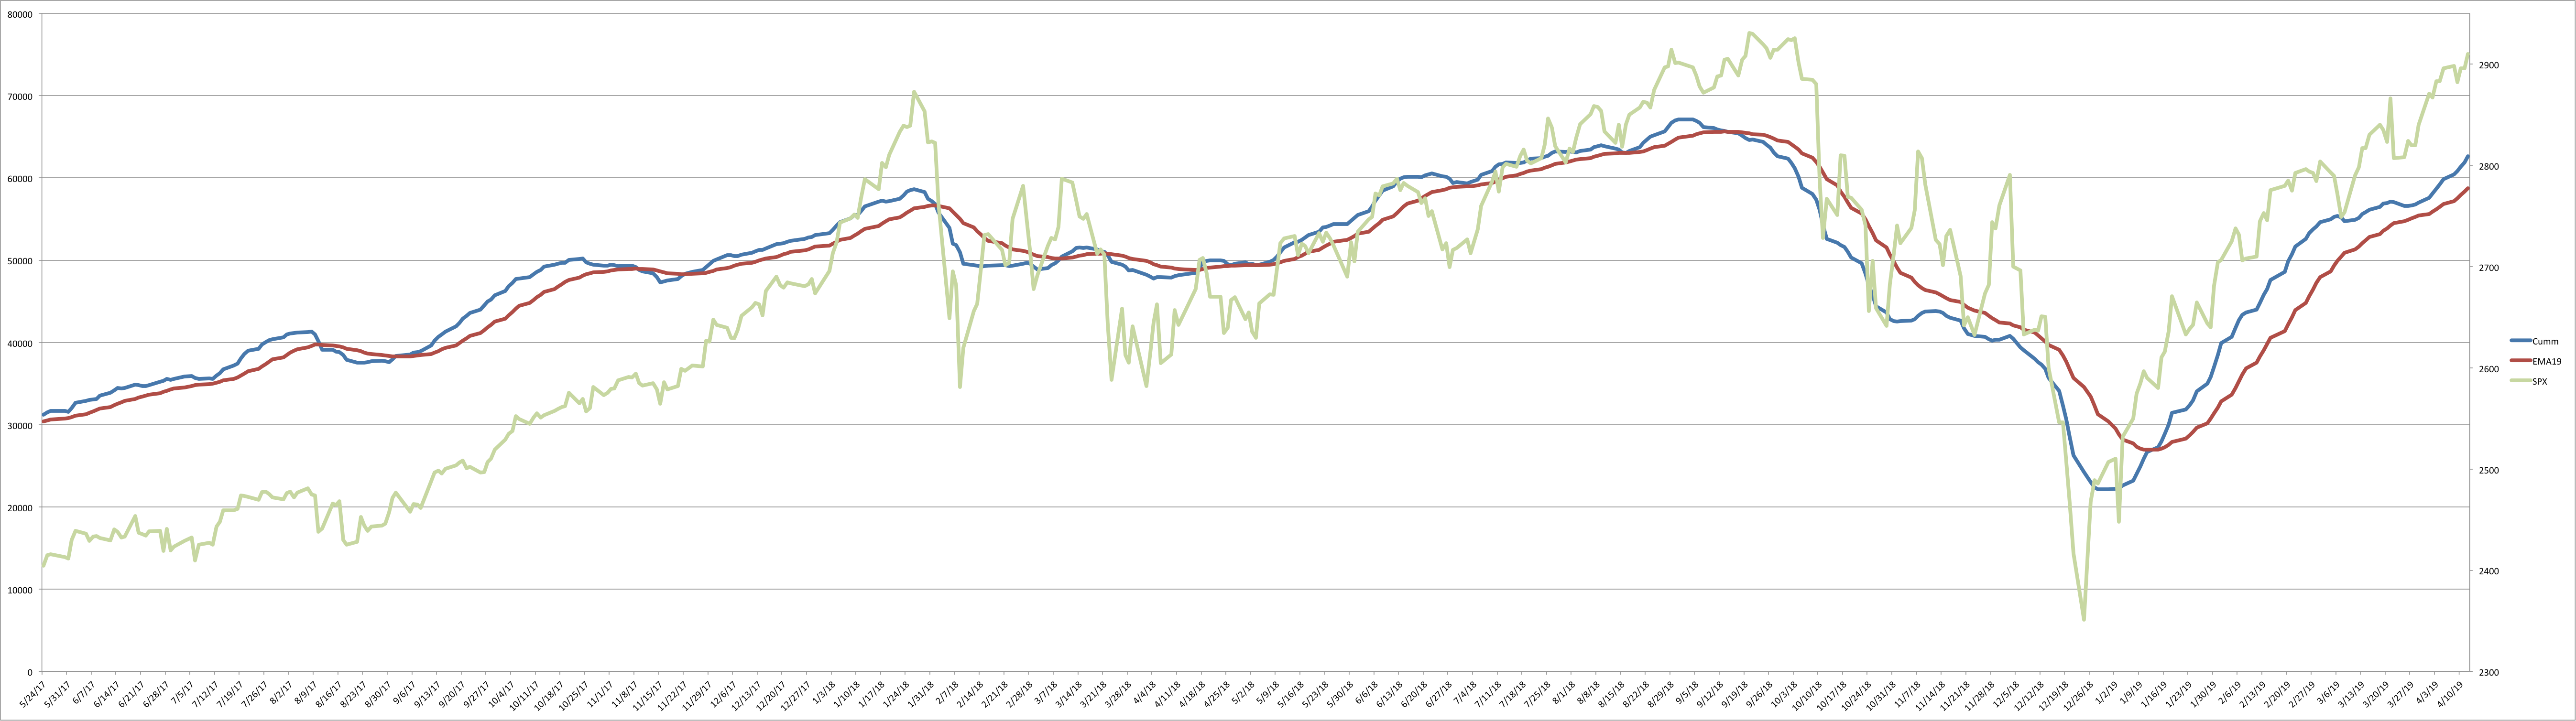
NYHL1M -
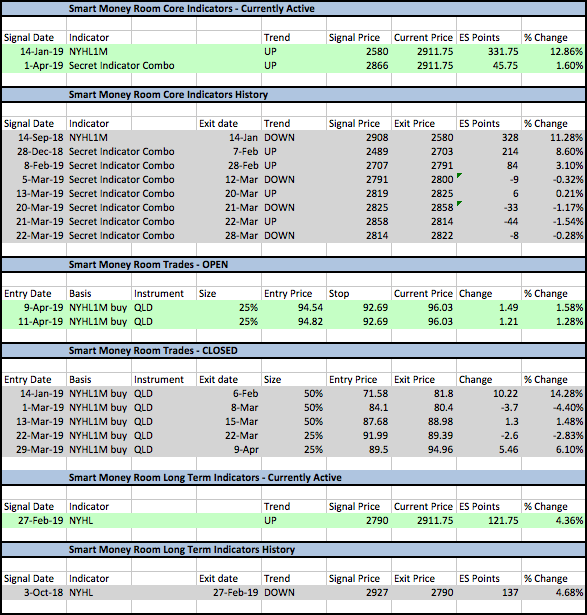
Trades:
This is what we did in actual trading last week in the SM room:
Booked our QLD long on Tuesday for 6.1%.
Re-entered back the same day and that position is up close to 1.5% right now. Added to this position yesterday with another tranche and that leg is up 1.2%.
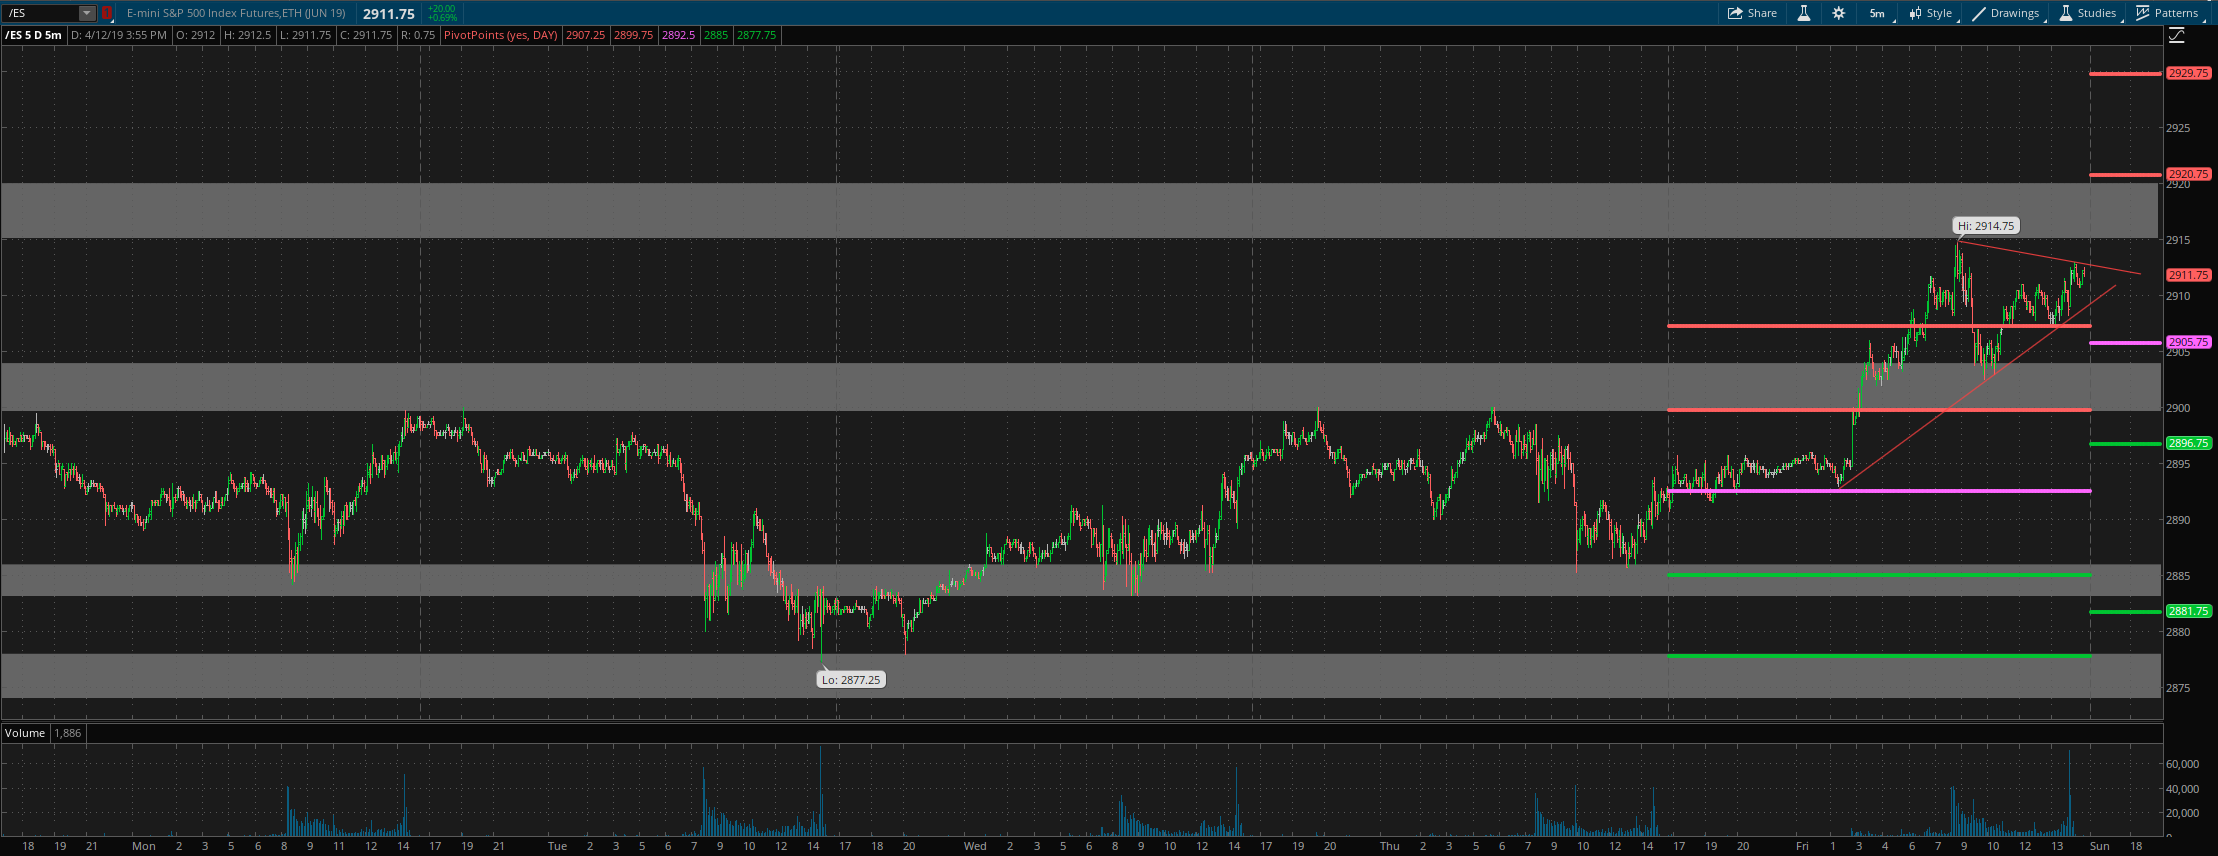
ES Grey Zone areas: On the upside, we are right below first resistance zone of 2915-20. Above this I have a major resistance area at 2945-2950. On the downside, first support is at 2903-2900, then 2886-83 and then 2878-74.
ES daily pivot is at 2906. Resistance R1 is at 2921 and R2 is at 2930. Support S1 is at 2897 and S2 is at 2882.
Here is a snapshot of the Smart Money Room Indicators and Trades.. Grey is closed. Green is active.
All the best to your trading week ahead.
