Most Indicators Signaling Long
 By
By
Last week the market pulled back from the 2850/2900 zone on the Emini S&P 500 (ES), as we had anticipated, and tested just above the 2700 support area before moving back higher to end the week near 2830.
What next?
Except for our long-term indicator, all other indicators of ours are on buy signals now. And our trading system also continues to be long. Options data has been slowly developing bullishness over the last few weeks though data from Friday is slightly bearish. Internal data has also been on the bullish side but not really by that much. Overall, while everything looks bullish for now, I think we need to get some kind of reset lower before price can continue to move higher. I think we can get a high somewhere in the 2850-2930 zone before beginning a pullback at a minimum. If we clear the 2930 area, then this idea is wrong.
Regardless of the idea that a pullback may happen, not even our shortest-term indicator has turned yet. Which means that our trading system is still long and so we will continue to hold a 50% long position in SPY until it turns to a sell.
ES Grey Zone areas: The grey zones on the ES 5 min chart below are what I draw in on a discretionary basis. They are support and resistance areas which the market is most likely to react from. If we test a zone from below, it is likely to be rejected and fall lower to test support zones below. If we test a zone from above, it is likely to take support there and begin a move higher. So these zones can be used for intraday trading and/or as entry points for positioning for swing trades. These zones are drawn in based on what the market has done there previously both on smaller and larger timeframes.
Grey zone resistance is at 2824-41. 2878-94 and then at 2930+/-5 . Support is at 2768-55 and then at 2721-10 area.
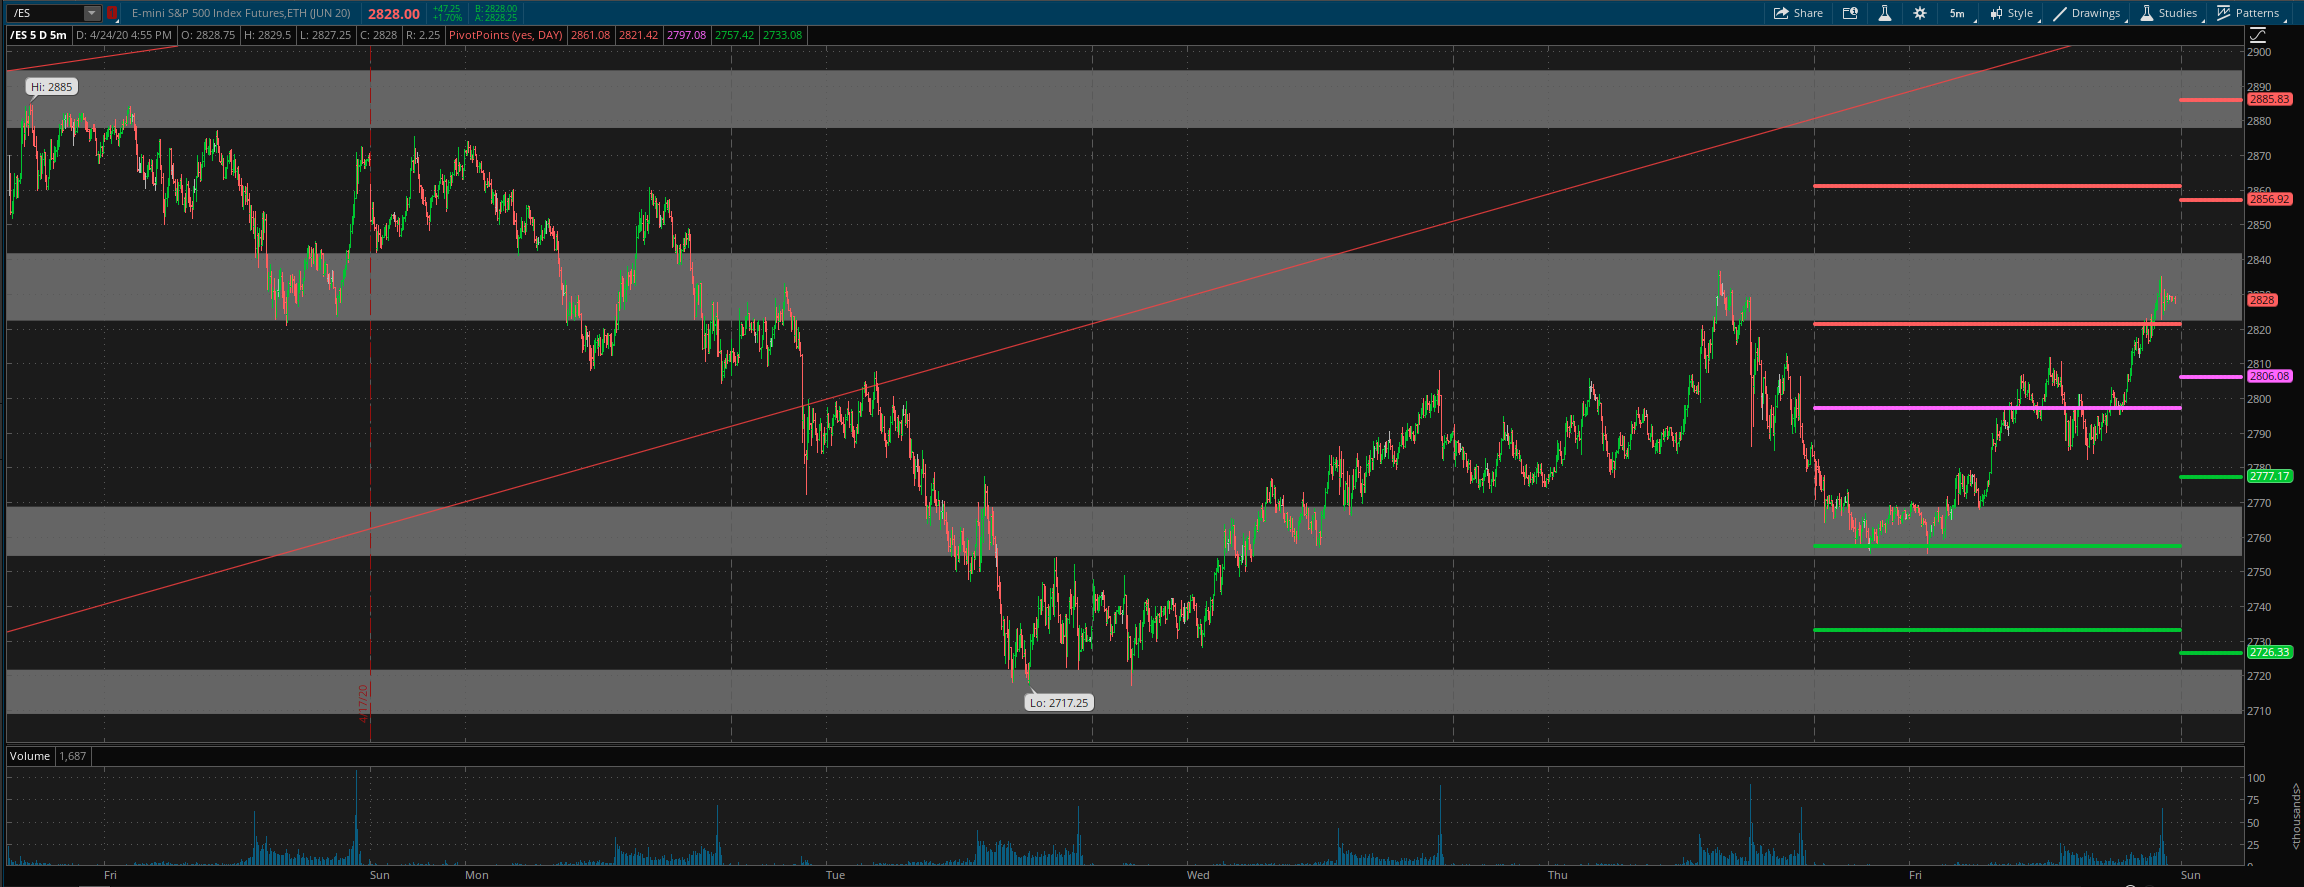
Daily pivot is at 2806. Resistance R1 is at 2857 and R2 at 2886 Support S1 is at 2777 and S2 at 2726.
All the best to your trading week ahead.
