Models Continue To Be Bullish
 By
By
In last weekend's update, I wrote:
"Buying support keeps coming in at support levels and this has to be viewed as bull market action. Right now, once again, most of our models are again on buy signals and we are long the market. Options data also came in bullish today though most of the bullish action is on shorter term expiries rather than longer term ones. On price, it looks to me like we extend to the 3200 area very soon and possibly a little higher than that before we finally get a reset lower to the breakout area around 3025 on ES. As always, we shall continue to use the NYHL1M and the micro1 component to guide our trading in the market along the path of least resistance - which for now, is still up."
What actually happened: Price followed through on the upside as expected, did not quite reach the 3200 level on the Emini S&P 500 (ES) last week but should do so soon.
What next? Most of our models continue on buy signals and we continue to be long the market. Options data looks reasonably bullish today as well. The only thing that looks bearish is the shape of the shorter term razzmatazz waves -- both versions -- so this is something to be watchful about. But price is still king and internals support us more or less still being long for now. Same as I wrote last week, on price, it looks to me like we extend to the 3200 area very soon and possibly a little higher than that before we finally get a reset lower to the breakout area around 3025 on ES. As always, no need to trade based on guesses and speculation -- we shall continue to use the NYHL1M and the micro1 component to guide our trading in the market along the path of least resistance, which for now is still up.
ES Grey Zone areas: The grey zones on the ES 5 min chart below are what I draw in on a discretionary basis - they are supports and resistance areas which the market is most likely to react from. If we test a zone from below, it is likely to be rejected and fall lower to test support zones below. If we test a zone from above, it is likely to take support there and begin a move higher. So these zones can be used for intraday trading and/or as entry points for positioning for swing trades. These zones are drawn in based on what the market has done there previously both on smaller and larger timeframes.
Grey zone resistance at 3183-88 and 3200-03. Support is at 3158-51, 3122-18, 3108-02 and then 3070-65.
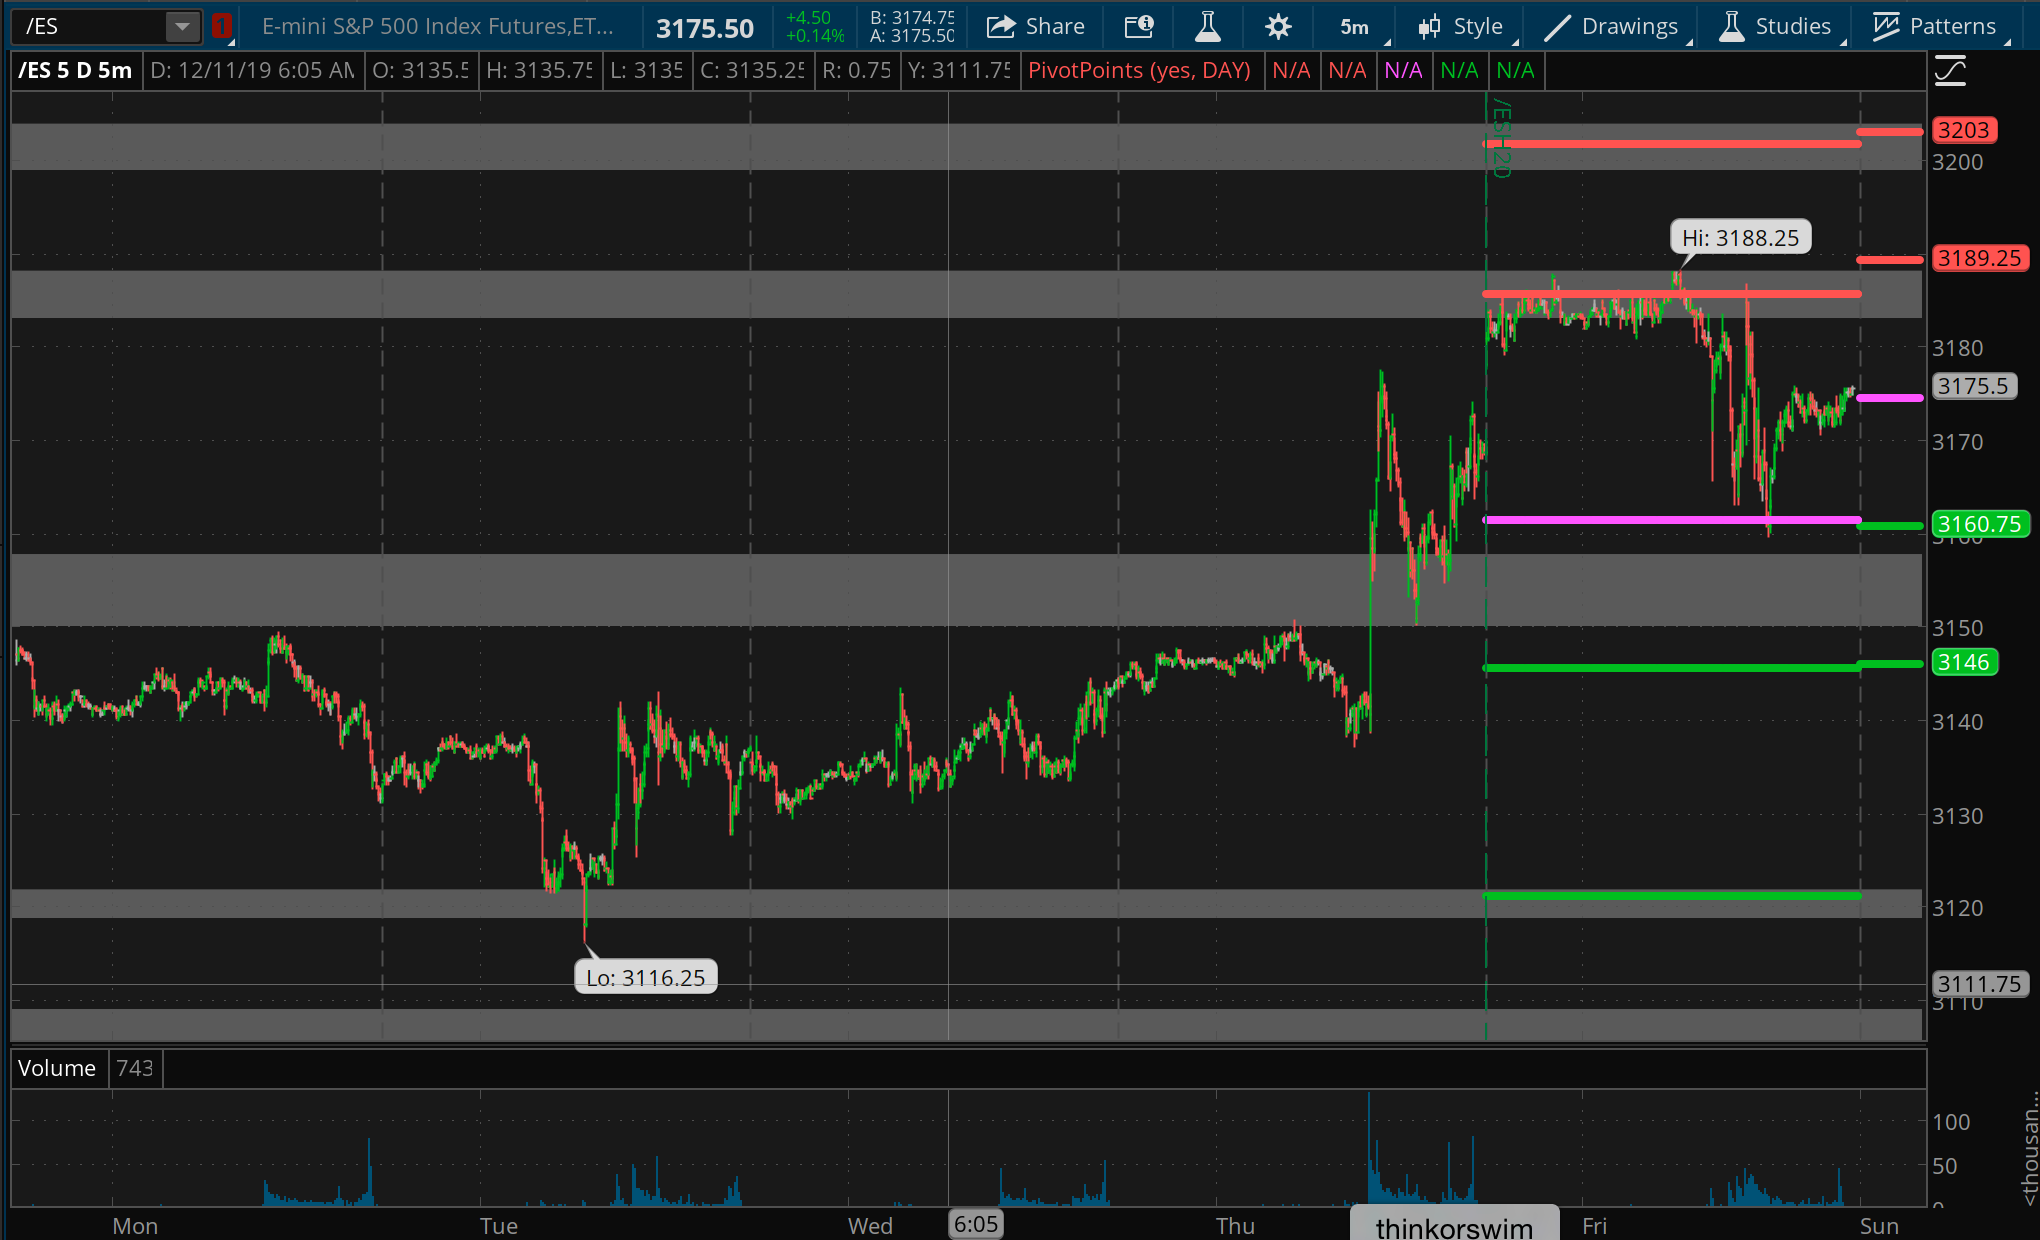
Daily pivot is at 3174.5. Resistance R1 is at 3189 and R2 at 3203. Support S1 is at 3161 and S2 at 3146.
All the best to your trading week ahead.
