Meeting Our 2950 Projection and Then Some: What's Next?
 By
By
In last weekend's report I wrote: "I am leaning toward the idea that we saw some kind of low Wednesday overnight and as long as that holds, we can go higher into the 2950 area in the coming week. Break 2867/65 area and we should test 2840 supports and below this 2800. I prefer the idea of testing higher into 2950 ... data, our indicators/signals seem to support this. And also we have what looks like a triangle/continuation pattern on the charts which support an immediate move higher."
What actually happened is that the Emini S&P 500 went above 2950 comfortably, almost hit 2970 and ended at 2948.25.
What next?
While we hit all time highs on Friday, it is most likely for us to have some weakness ahead in coming days. I do not know how much of a pullback we will have, but some digestion of these gains will be a good thing for the market. Our open interest curve or the razzmatazz wave also suggests some kind of pullback or sideways consolidation into the beginning of July.
While I think we get some kind of pullback, I do not think this is shorting opportunity but just a pause to refresh for more gains. I think we get to somewhere around the 3000-3020 area before a more significant top forms. Regardless, we will continue to use our indicators to tell us when to exit our long positions and/or short the market.
ES Grey Zone areas: The grey zones on the ES 5 min chart below are what I draw in on a discretionary basis. They are support and resistance areas which the market is most likely to react from. If we test a zone from below, it is likely to be rejected and fall lower to test support zones below. If we test a zone from above, it is likely to take support there and begin a move higher. So these zones can be used for intraday trading and/or as entry points for positioning for swing trades. These zones are drawn in based on what the market has done there previously both on smaller and larger timeframes.
Grey zone support now is at 2939-31, then 2911-2903 and 2875-67. Resistance zone at 2958-2967, and if we get above this, I think we hit resistance next at 2980 and then 3000.
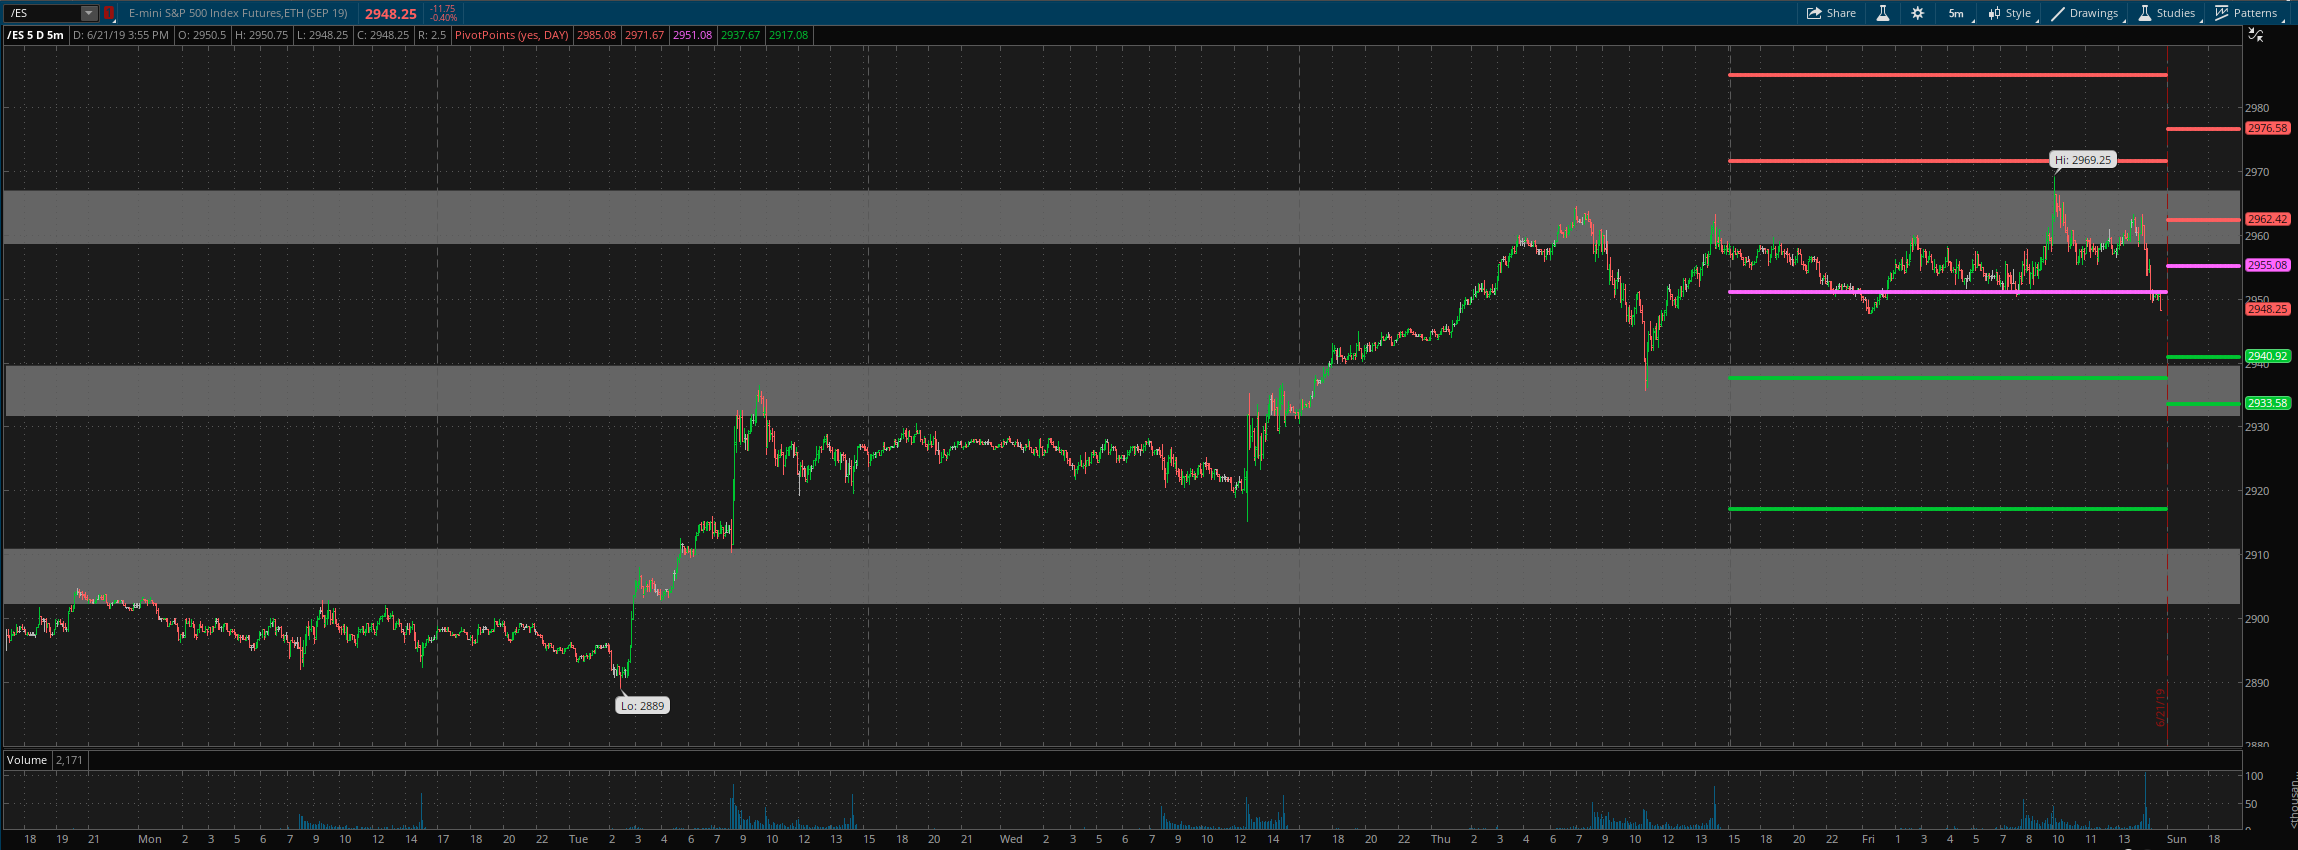
For Monday the daily pivot is at 2955. Resistance R1 is at 2962.5 and R2 at 2976.5. Support S1 is at 2941 and S2 at 2933.5.
All the best to your trading week ahead.
