Market Poised to Test Higher?
 By
By
As I noted in last weekend’s update: "We look at the Wednesday of this week for clues on what to expect into next week's OPEX. Generally, we get a nice pullback into the Wednesday referred to as WWW - the Wednesday of the week before monthly options expiration week. And after this pullback, we get a rally into Opex week. This time however, we are moving higher into WWW, so we have the possibility of setting up a decline into OPEX. This is certainly a less likely scenario if you look at all monthly OPEX’s. However if you look at quarterly OPEX’s alone, the odds increase greatly for the bearish outcome to play out."
What actually happened: We were mostly sideways during the week. No real high or low discernible for Wednesday, so we’ll call last weekend's forecast a wash.
What next?
No clear cut low or high is visible for Wednesday, so it is unclear how the next week will play out. I am leaning toward the idea that we saw some kind of low Wednesday overnight and as long as that holds we can go higher into the 2950 area on the S&P 500 in the coming week. Break 2867/65 area and we should test 2840 supports and below this 2800.
I prefer the idea of testing higher into 2950, which our indicators/signals seem to support. And also we have what looks like a triangle/continuation pattern on the charts which support an immediate move higher. Bigger picture, I am neutral at the moment. I do not see a lot that makes me very bullish right now, so short term while I think we can still go higher, medium term, I do not think that we are completely out of the woods yet. But we will wait for our signals/indicators to turn before taking trades in the bearish direction.
ES Grey Zone areas - The grey zones on the ES 5 min chart below are what I draw in on a discretionary basis - they are supports and resistance areas which the market is most likely to react from. If we test a zone from below, it is likely to be rejected and fall lower to test support zones below. If we test a zone from above, it is likely to take support there and begin a move higher. So these zones can be used for intraday trading and/or as entry points for positioning for swing trades. These zones are drawn in based on what the market has done there previously both on smaller and larger timeframes.
On the upside, we have grey zone resistance at 2903-2912 and then 2929-36. On the downside, we have support at 2875-68 and then at 2845-38.
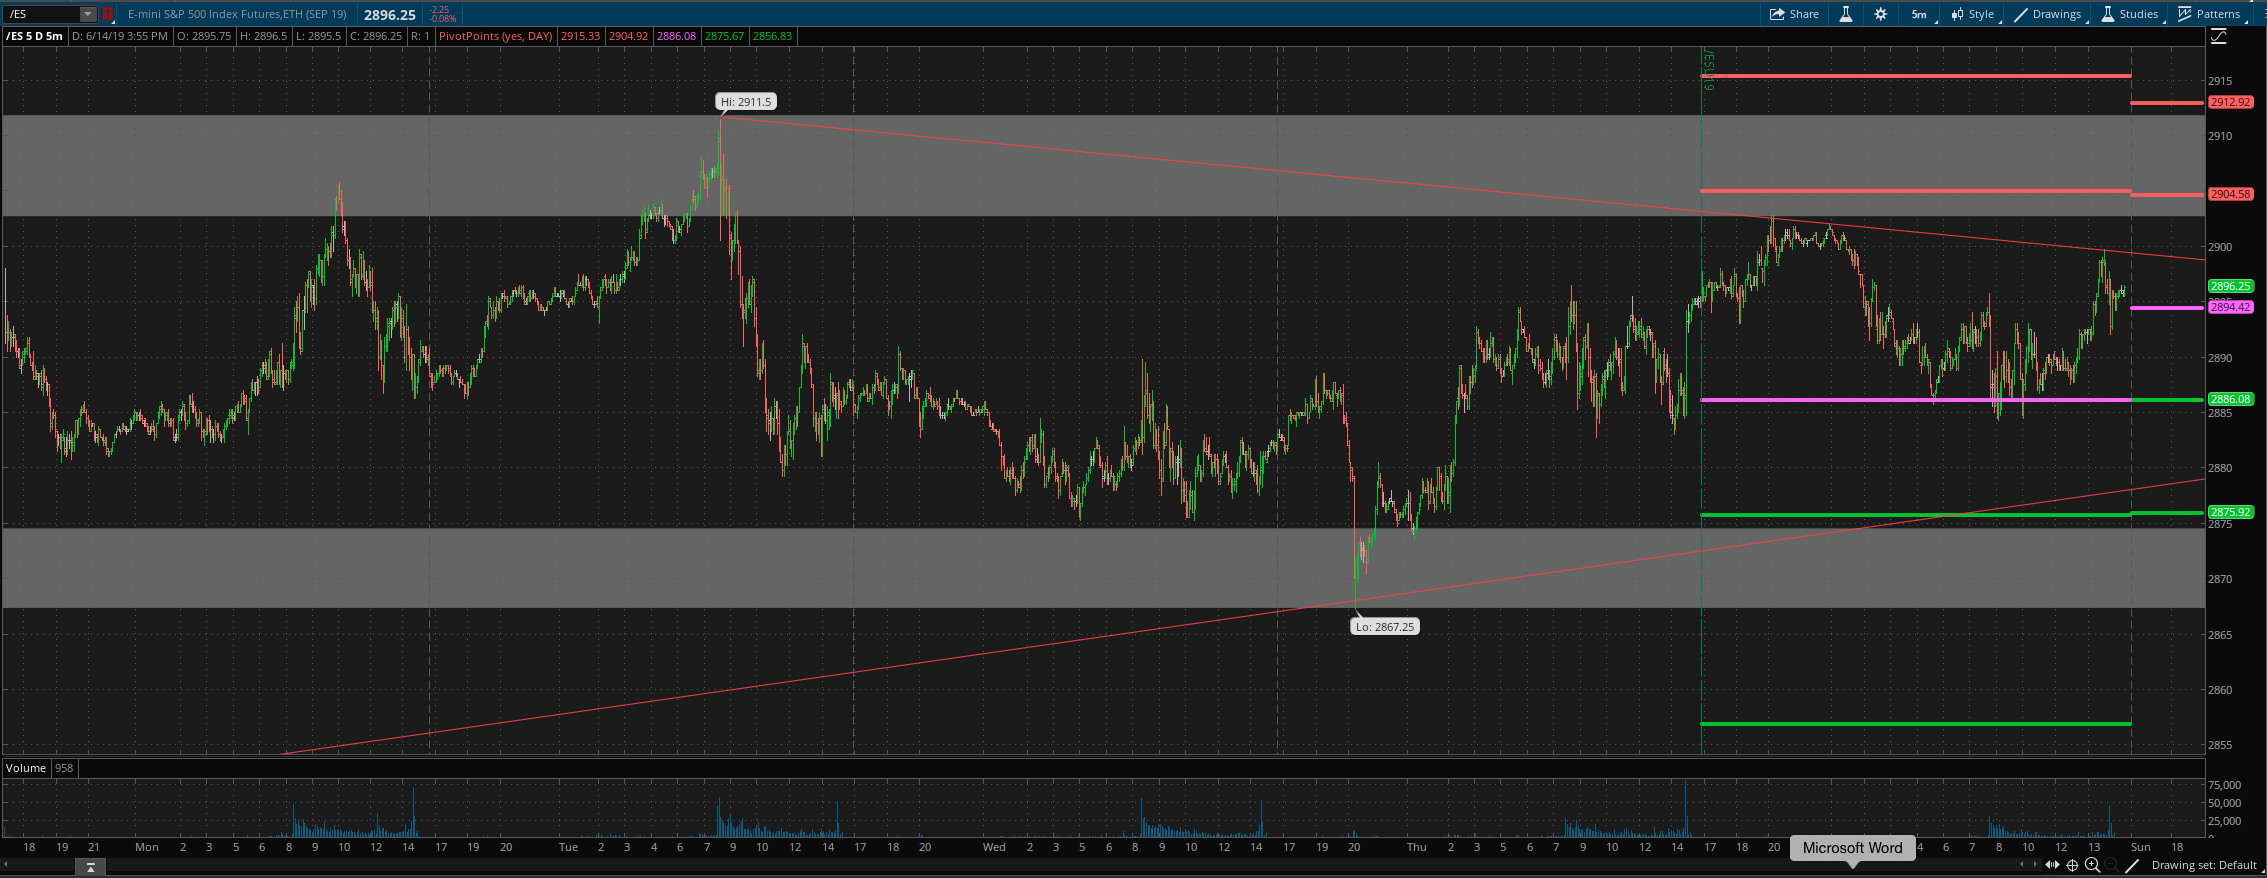
ES daily pivot is at 2894.5. Resistance R1 is at 2904.5 and R2 is at 2913. Support S1 is at 2886 and S2 is at 2876.
All the best to your trading week ahead.
