Market In Grey Area After Hitting Our Projected Zone
 By
By
In last weekend's update we wrote: "We hit the projected 3450/3500 area but I think we can extend a bit more toward 3520/50 area and maybe even a double top."
What actually happened: We made it to 3541, setting highs very early in the week before drifting mostly sideways to end the week flat.
Looking ahead: Internals look more or less bullish. Options data is neutral. Price action is neutral both short and medium term and bullish long term. We hit the projected 3520/50 zone on the Emini S&P 500 (ES) very early in the week and were mostly sideways since then. Market is in a bit of a grey area right now.
I see two possibilities here: One is that we go directly higher and set a new all time high somewhere above 3600, which then sets up a bigger pullback/selloff. Or we have some more basing to do in the 3430/20 area before another move North. And IF we break the 3430/3420 support area, a test of 3350 at minimum and probably lower becomes the higher probability.
Not a lot more to say here really. We have to wait for the market to show its hand here. Regardless, our indicators continue on buy signals. The Smart Money Composite signal continues on the long side. Odds signal is also long. So we are also holding all our long positions until either of the signals changes.
ES Grey Zone areas: Grey zone resistance at 3470-85 and then at 3528-40. Support is at 3436-24, 3389-74 and then at 3340-29.
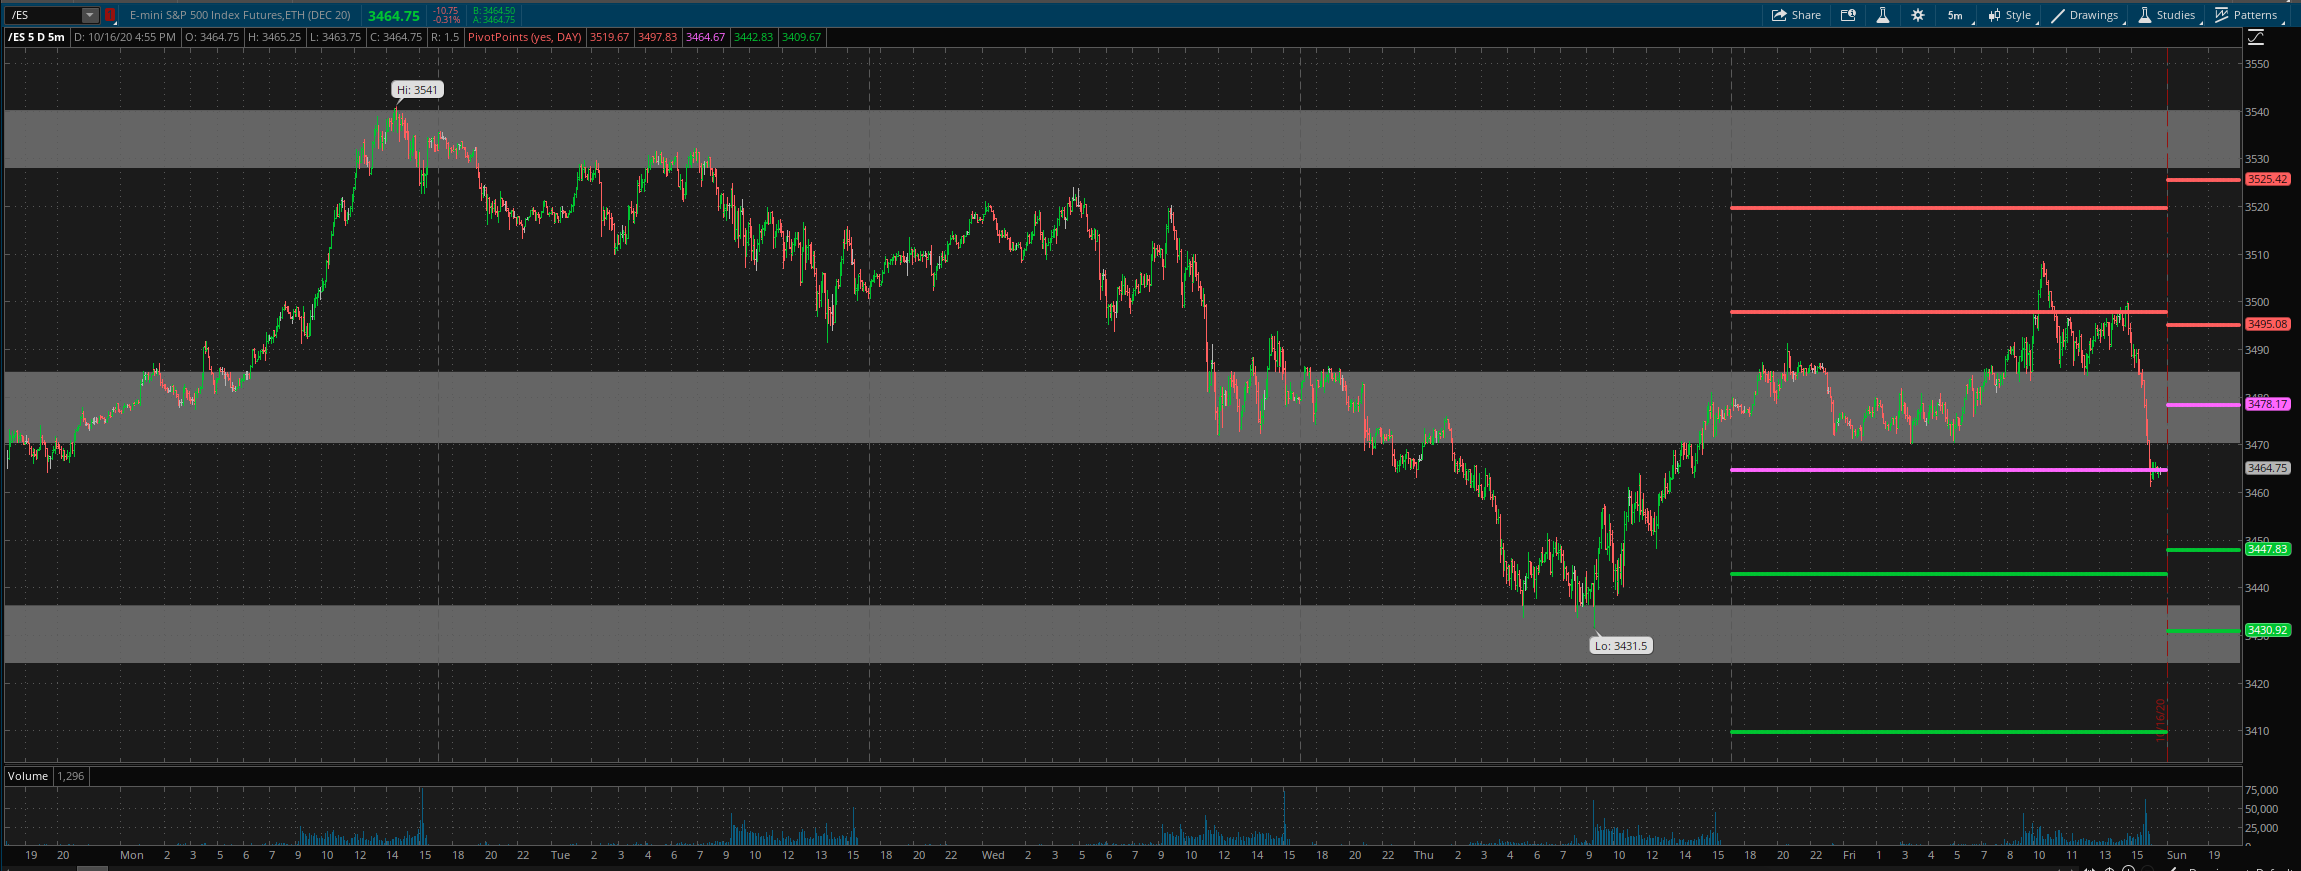
For Monday, daily pivot is at 3478. Resistance R1 is at 3495 and R2 at 3525.5. Support S1 is at 3448 and S2 at 3431.
Current trade evolution along with position tracking snapshots
All the best to your trading week ahead.
