Market At An Inflection Point
 By
By
In last weekend's report, I wrote: "As we get closer to the 200 day moving average and considering the run we have had so far, it makes sense to have some kind of reset/pullback lower. I am not looking for anything very bearish.. just a reset toward maybe the 3800 area.. and then higher highs again. Internal measures are looking much better right now however sentiment has become a bit too bullish. So a move lower to reset that before we can continue higher seems like the higher probability path to me. 4080 area is next resistance on the upside and 4000/3995 is support on the downside."
What actually happened is it was a volatile week with price testing both highs and lows of a wide range before settling 30 points higher on the week.
Looking ahead this week, price action is bullish/neutral short term, bullish medium term and neutral long term. The market is at an inflection point at the moment -- we are consolidating below a long-term trend line that has held back any advance attempt since THE top. Getting above that line and closing above will be a big statement from the bulls -- IF it can happen.
Long-term internal buy signals are also very close to triggering. However, short-term I am leaning toward a pullback, and this pullback will tell us a lot. It could be a very shallow pullback that holds up above 4000 or maybe the 3900 area. But if 3900 goes, then the 3800/3750 area is likely to hit. Short-term internals all stay on buys, but our Odds Indicator is holding onto a sell signal. On the whole, bigger picture, things are looking much better for the market.. but short term, I am thinking we get a pullback/reset of sorts before we are ready to move back higher.
ES Grey Zone areas: The grey zones on the ES 5 min chart below are what I draw in on a discretionary basis - they are supports and resistance areas which the market is most likely to react from. If we test a zone from below, it is likely to be rejected and fall lower to test support zones below. If we test a zone from above, it is likely to take support there and begin a move higher. So these zones can be used for intraday trading and/or as entry points for positioning for swing trades. These zones are drawn in based on what the market has done there previously both on smaller and larger timeframes.
Grey zone resistance at 4093/4110 and then the 4150 area. Support is at 4053-37, 4008/3992 and then 3955-41.
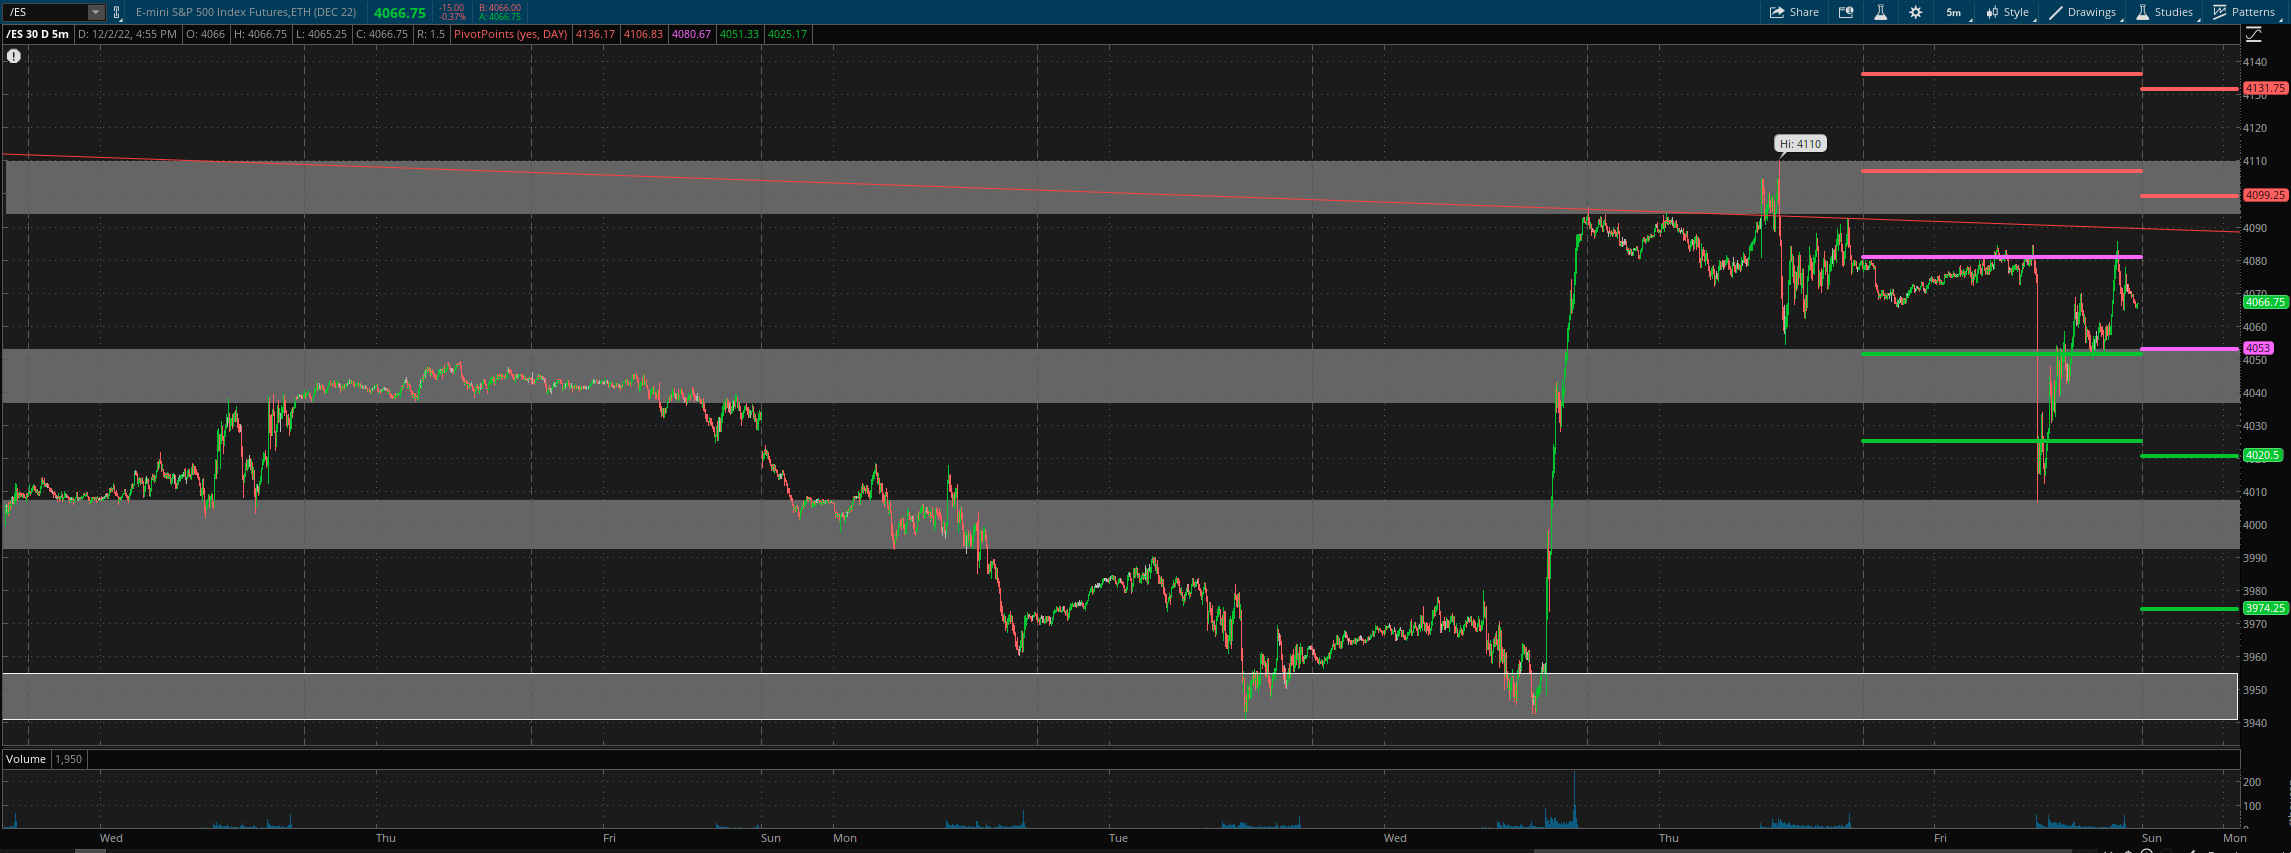
For Monday, daily pivot is at 4053. Resistance R1 is at 4099 and R2 at 4132. Support S1 is at 4020.5 and S2 at 3974.
All the best to your trading week ahead.
