Looking For A Low
 By
By
In last weekend's report, I wrote: "I think we can attempt one more high toward the 4650 area before a more meaningful correction sets in. On price, 4615/20 area is resistance on the upside, and 4580 area is support on the downside."
What actually happened is the Emini S&P 500 hit just above the 4620 resistance area and sold off.
Last week was one of the more bearish weeks in a while. Our Odds Indicator was short for almost all of the down move last week before going flat and then long at the end of the week.
Looking ahead, price action is bearish short term, bearish/neutral medium term and bullish long term. Right now, internals are mostly on the sell side at least for the very short term, but longer term ones are still on buys. Our Odds Indicator is also suggesting we get at least a bounce/rebound from this area. I expect we form a low somewhere between here and 4450 and begin a rebound rally toward 4560 maybe 4600, and then we see if it can turn into something more. Definitely a character change last week, but I think it may be too early to complete write the bull off.
Grey zone resistance at 4510-18 and then 4538-47. Support is at 4495-88 and 4460-51.
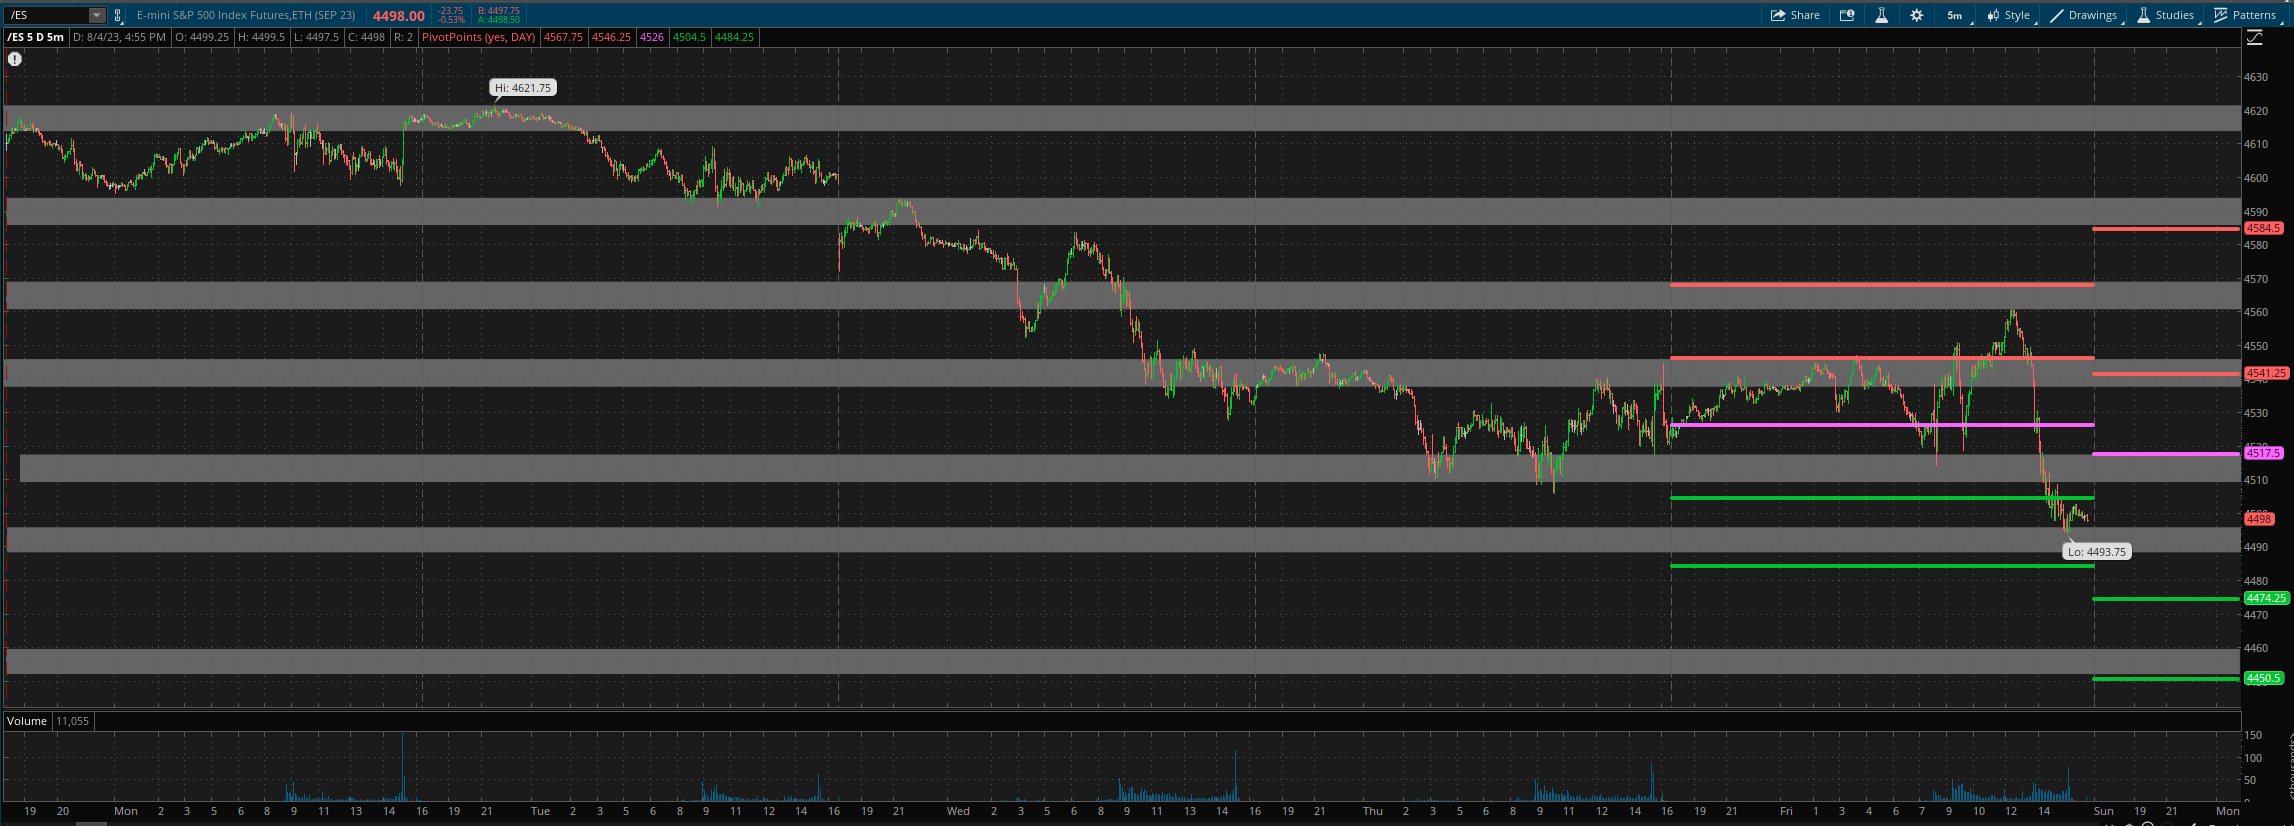
For Monday, daily pivot is at 4517.5. Resistance R1 is at 4541 and R2 at 4584.5. Support S1 is at 4474 and S2 at 4450.5.
All the best to your trading week ahead.
