Long Signals But Possible Weakness Early in the Week
 By
By
In our report last weekend, we wrote:
Weak upmove over the week. And a lot of mixed signs from the indicators we track in the Smart money room. Options data is short term bullish but beyond couple of weeks looks bearish. Difficult this week to make a forecast on what to expect in price. But I think there is a decent chance for us to make a new high above 2866 near the 2880 area but my confidence on this idea is not very high as of now.
The market followed our inclination and the path of least resistance, making a new high above 2866 and even exceeding the 2880 area comfortably.
What's next?
The Smart Money models remain on buy signals across the board. Open interest (OI) suggests some weakness in the beginning of the week ahead. This also ties in nicely with historical norms of having a pullback on the week before monthly options expiration. This is known as WWW -- the Wednesday of the week before options expiration. My thought is that we get some weakness into Wednesday this week, set a low and then begin a move higher into Opex week -- i.e., the week of April 18th.
On price, we have reached the 2900 round number territory where it is very likely for us to see some kind of pullback. This also suggests we see some weakness dead ahead. I also think that this weakness may just give bears some false hope in the very short term. Lasting weakness may only come after April Opex is out of the way. One step at a time, though.
The NYHL1M positional model (based on tracking new highs minus new lows on the NYSE) continues to help me take a lot of guess work out of the equation when positioning with the trend. The model went to a sell signal on Sep 14 last year. ES was at 2908. It went back to a buy on Jan 14 this year capturing 328 points. Since the buy on Jan 14th when ES was at 2580, to date, it has captured 320 points.
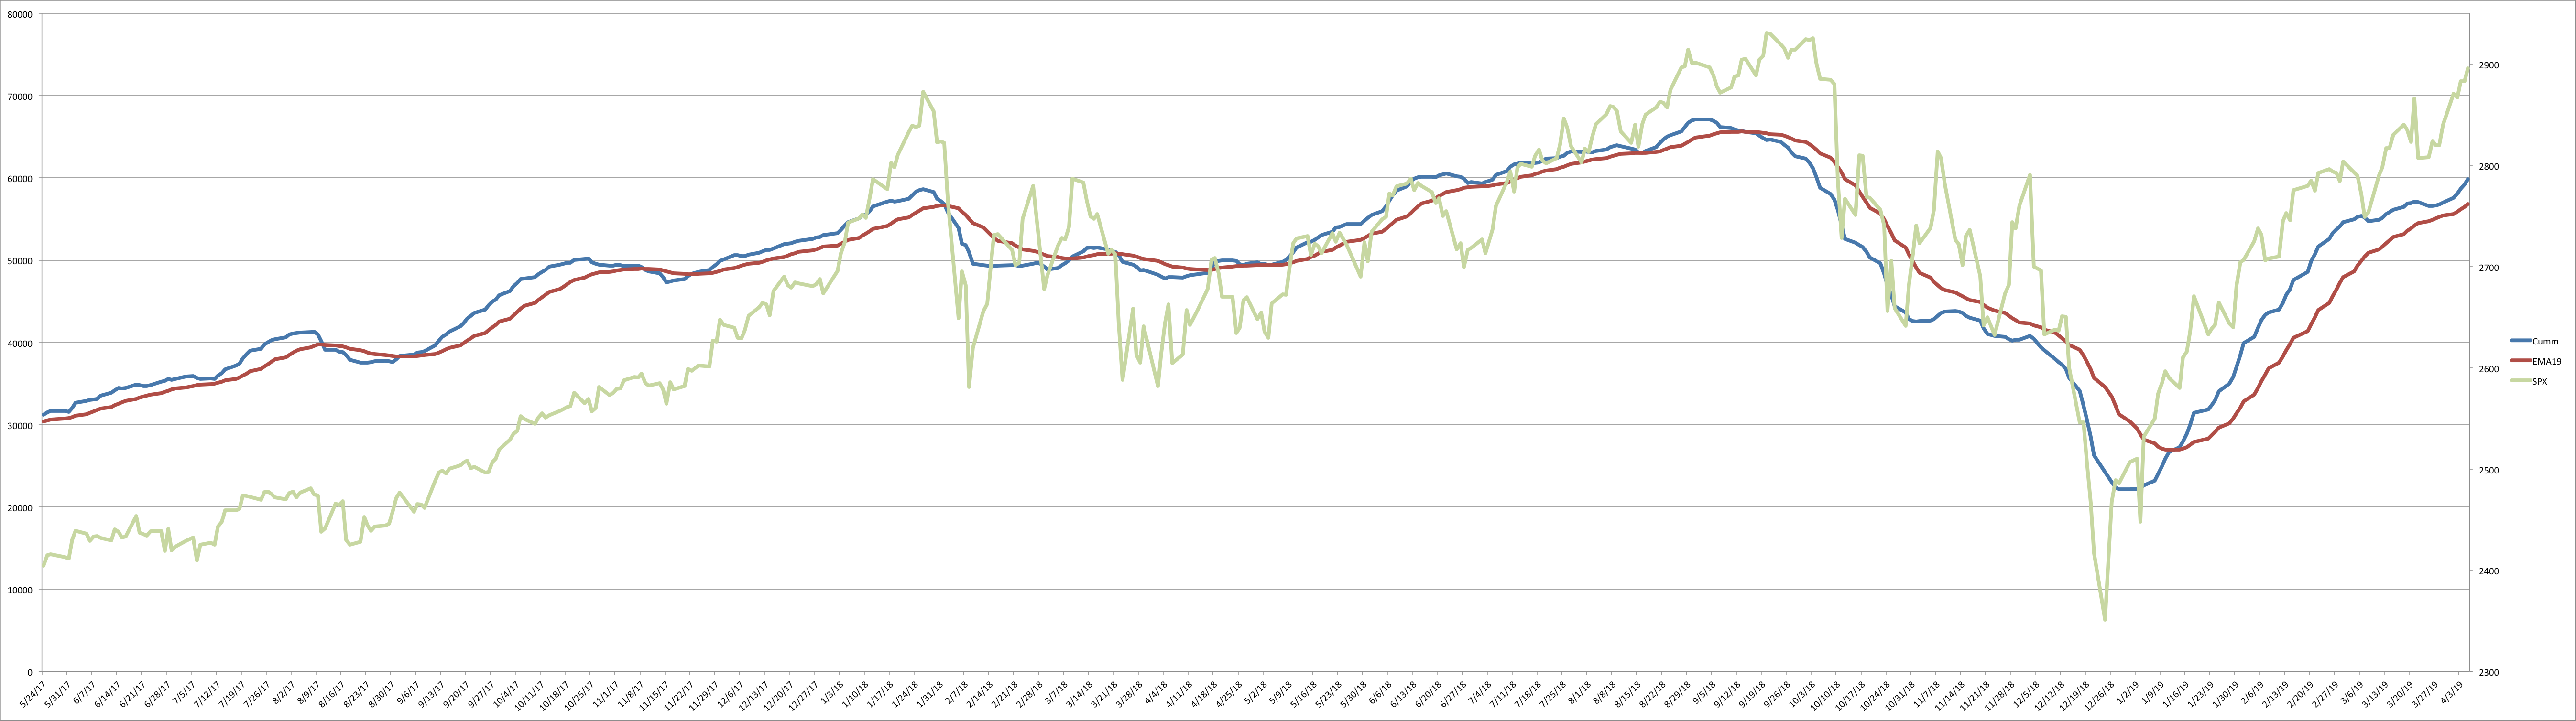
Read more on the NYHL1M model and other indicators/trades we cover in the Smart Money room HERE.
What’s new in the Smart Money Room?
We now have Trades and Indicators entries and exits/buy and sell signals tracked in table form in the Smart Money room. Trades are provided with entries, stops and exits. I posted the screenshots in this post: https://www.elliottwavetrader.net/members/atchat/?threadId=5202052
If anyone wants to know more about what we do in the Smart Money room, start with this video I did recently:
ES Grey Zone areas: On the upside, we are right below first resistance zone of 2898-2903. Above this I have a major resistance area at 2945-2950 but cannot really spot anything in between these two. On the downside, first support is at 2889-84, then 2870-65 and then 2854-50.
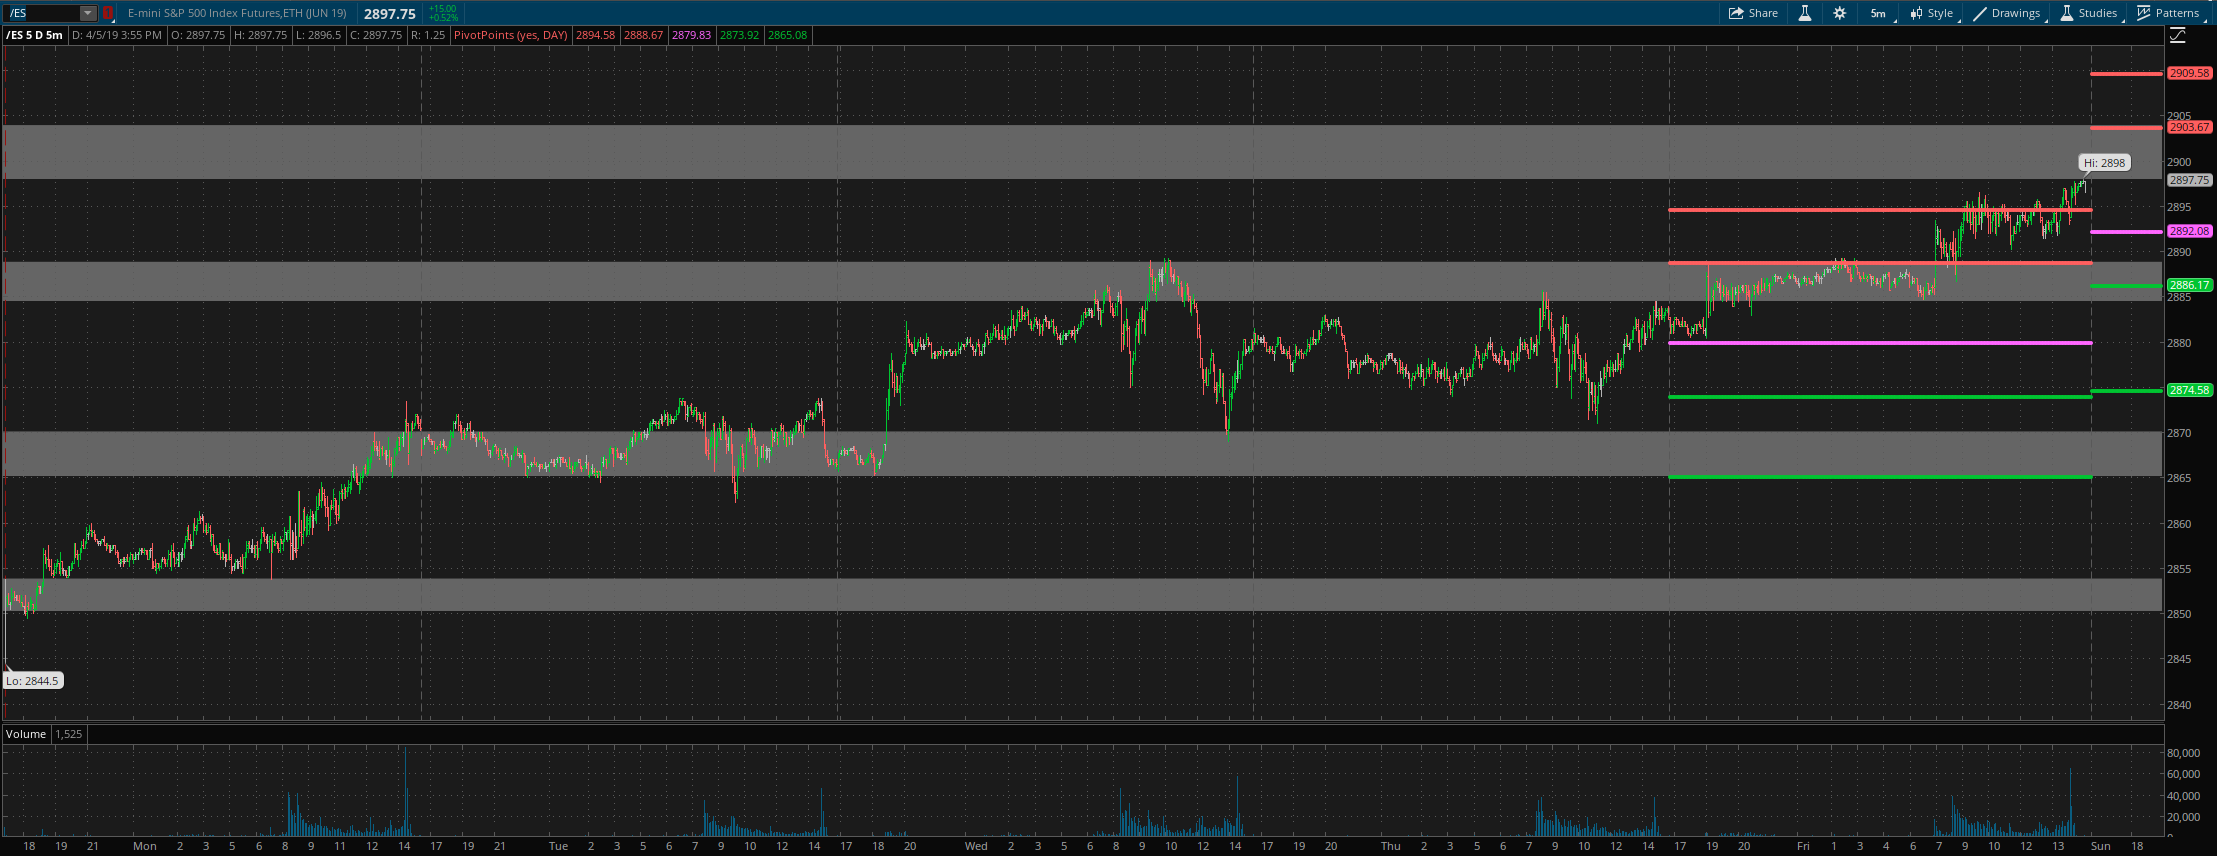
ES daily pivot is at 2892. Resistance R1 is at 2903.5 and R2 is at 2909.5. Support S1 is at 2886 and S2 is at 2874.5.
All the best to your trading week ahead.
