Locking In Gains Ahead Of Next Set-Up
 By
By
In last weekend’s update, I noted, "I think we need to get some kind of reset lower before price can continue to move higher. I think we can get a high somewhere in the 2850-2930 zone before beginning a pullback at a minimum."
What actually happened is price overshot my 2930 level on the S&P 500 by a bit before the selloff began. Our system went neutral on Friday allowing us to lock in gains in our long trades in the 2850 area, having been long over the last one month, ending up with 11.2% gains in QQQ and 2.8% in SPY.
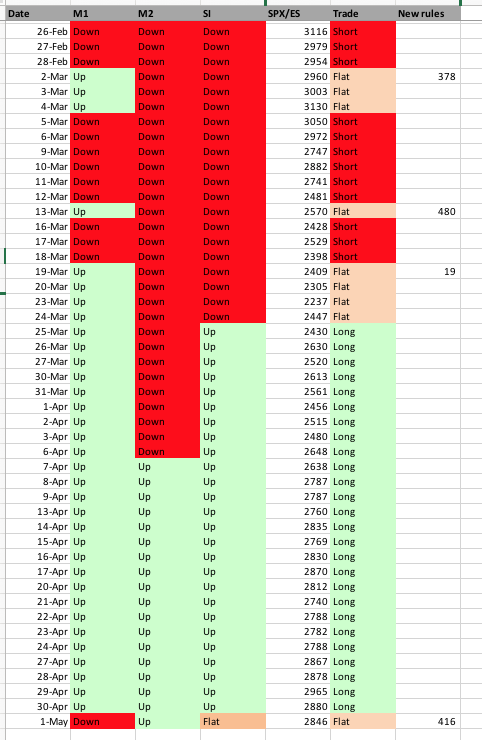
Below is a sheet which shows the system trades for the year based on the Smart Money room rules. Last trade was long from March 25th until May 1st when it went flat netting around 416 points.
What next?
Short term indicators are slowly joining the sell side. System is still flat due to lack of support from other indicators but we could have a system short trade develop soon. Internals look ugly over the last couple of days. Most likely some kind of bounce develops over the next few days, but I think we saw an important top at 2965 and we need to test lower levels near 2500 before another move higher. We currently do not have a position since system is flat but after we bounce a little bit, we may be able to get in on the short side. For now, we wait for a clear trade to setup before jumping in on it. And remember this could be on the long side too -- whatever it is, we jump back in no questions asked.
ES Grey Zone areas: The grey zones on the ES 5 min chart below are what I draw in on a discretionary basis -- they are support and resistance areas which the market is most likely to react from. If we test a zone from below, it is likely to be rejected and fall lower to test support zones below. If we test a zone from above, it is likely to take support there and begin a move higher. So these zones can be used for intraday trading and/or as entry points for positioning for swing trades. These zones are drawn in based on what the market has done there previously both on smaller and larger timeframes.
Grey zone resistance is at 2831-49. 2904-20 and then at 2960-72 . Support is at 2813-2800 and then at 2768-54 area.
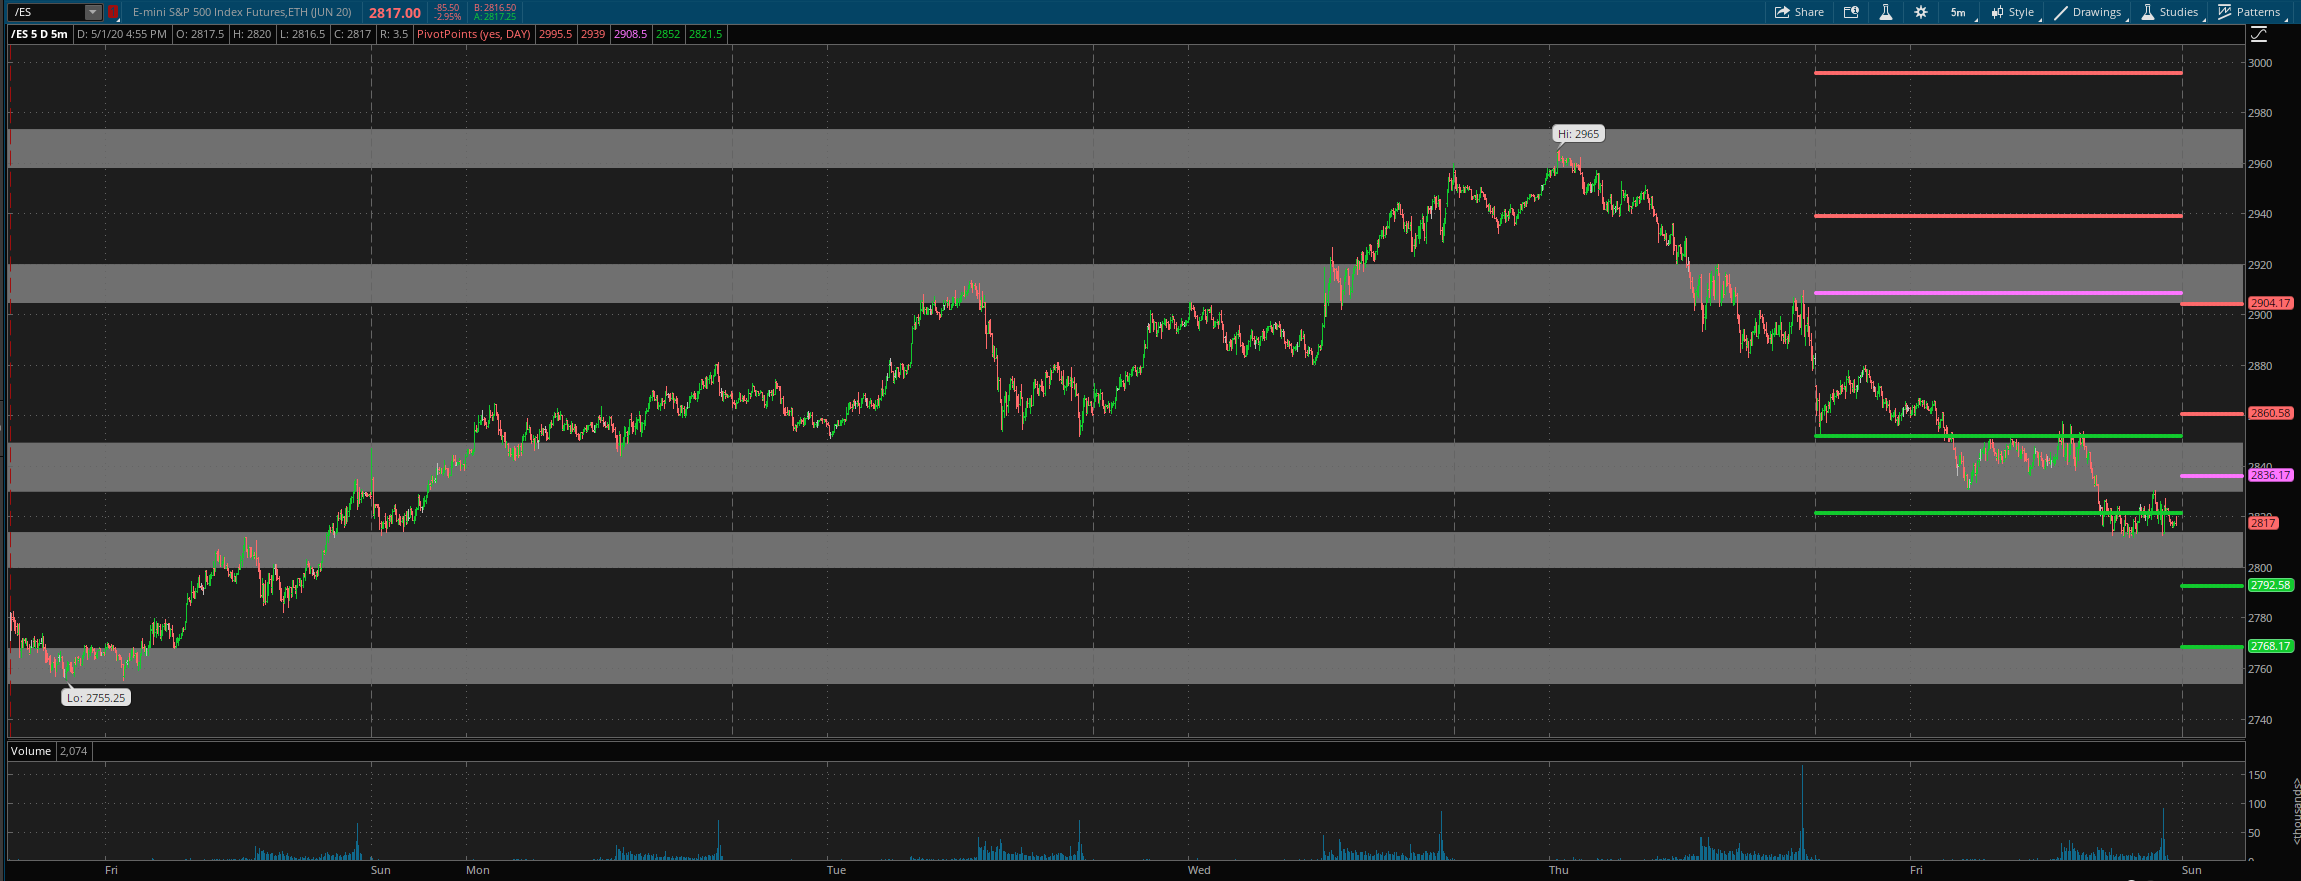
Daily pivot is at 2836. Resistance R1 is at 2860.5 and R2 at 2904. Support S1 is at 2792.5 and S2 at 2768.
All the best to your trading week ahead.
