Limited Upside Ahead - Market Analysis for Jul 5th, 2020
 By
By
The Emini S&P 500 (ES) only made it down as far as the 2980 area last week before a rebound back into the 3100s.
Internals look better than they did last week, but not by that much. Options data is more toward the neutral side, but the Razzmatazz models all look more bearish than bullish right now. Price by itself looks reasonably bullish in the short term and range-bound in the intermediate term. All of our short-term indicators went to buys last week and we have a long trade on right now supported by acceptable odds on it.
However, based on the posture of internals and options data, I am not looking for much upside on this trade. I think we get to somewhere in the 3200 area before beginning another leg lower toward the 2800 area. But, as always, we will stay with the trade until our indicators actually tell us to exit.
ES Grey Zone areas: Grey zone resistance at 3144-56 and then at 3181-95. Support is at 3076-62 and then at 3000-2983.
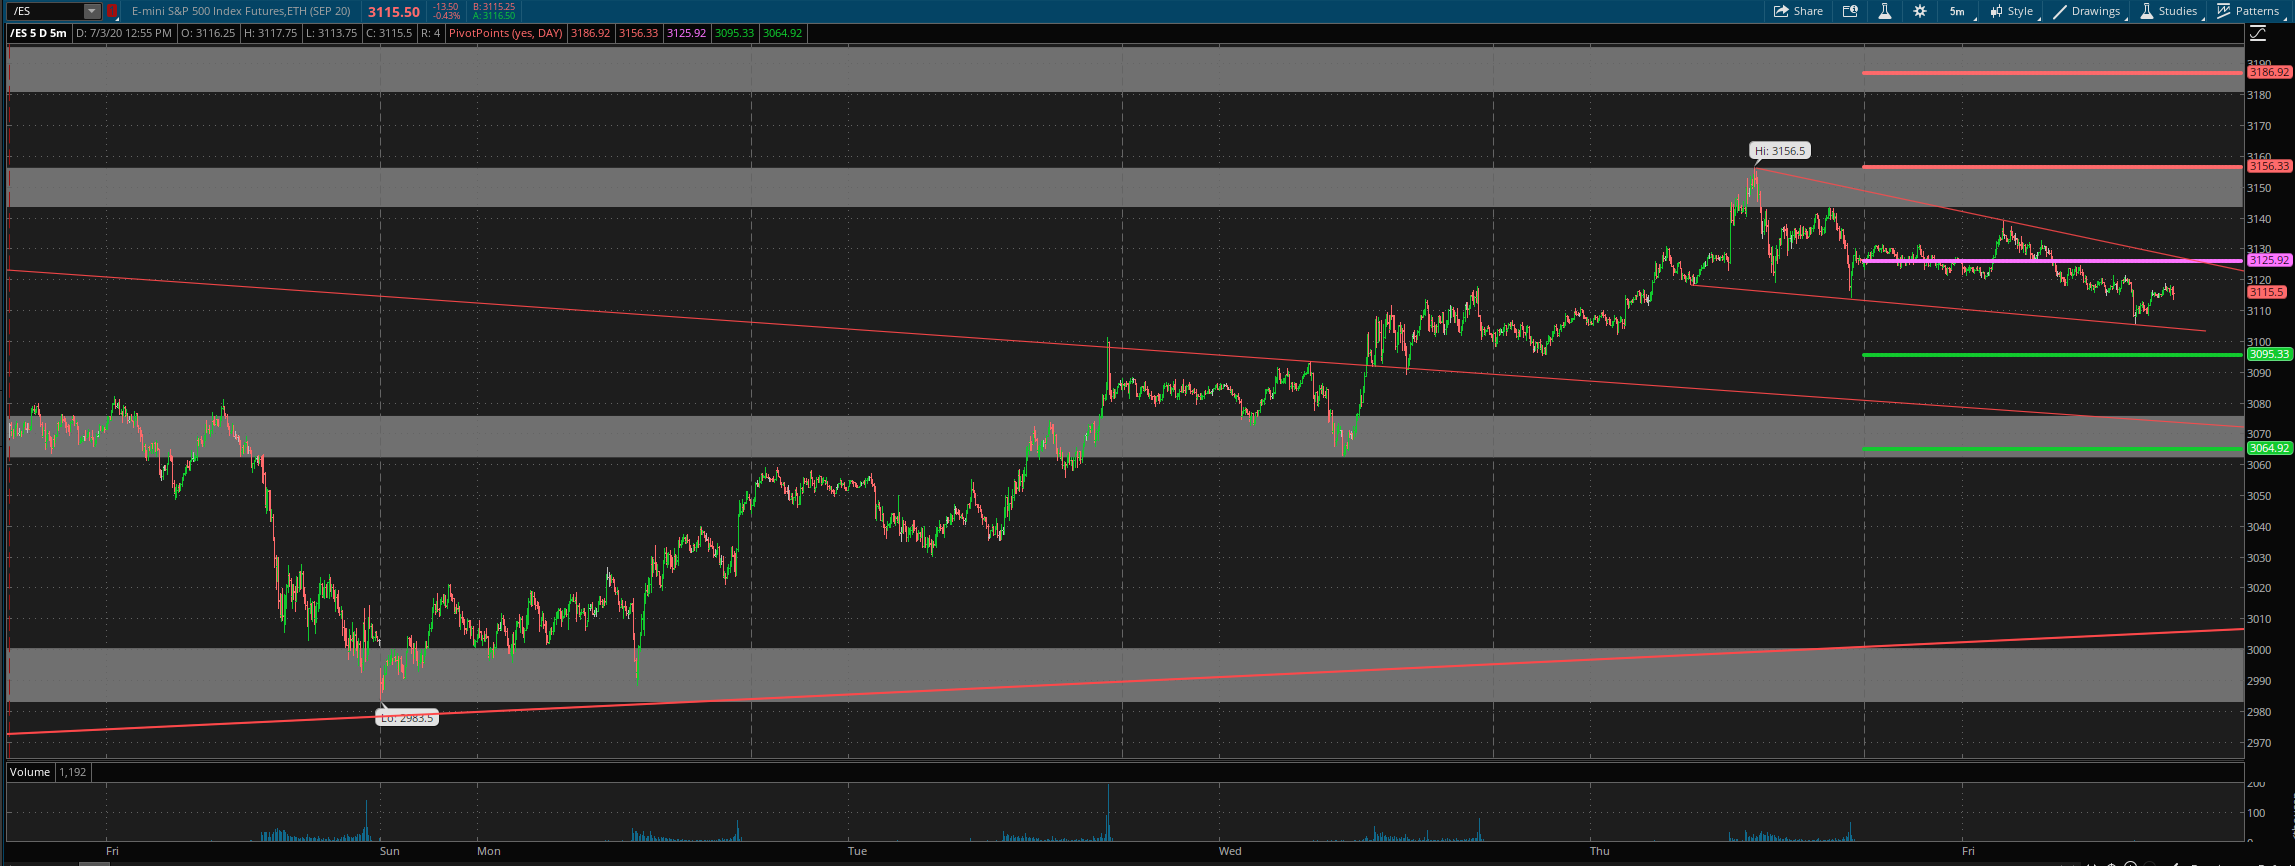
For Monday, daily pivot is at 3126. Resistance R1 is at 3156 and R2 at 3187. Support S1 is at 3095 and S2 at 3065.
All the best to your trading week ahead.
