Is This Pullback The Last Swing Long Setup In This Bullish Cycle From 2022?
 By
Jason Appel
By
Jason Appel
Is This Pullback The Last Swing Long Setup In This Bullish Cycle From 2022?
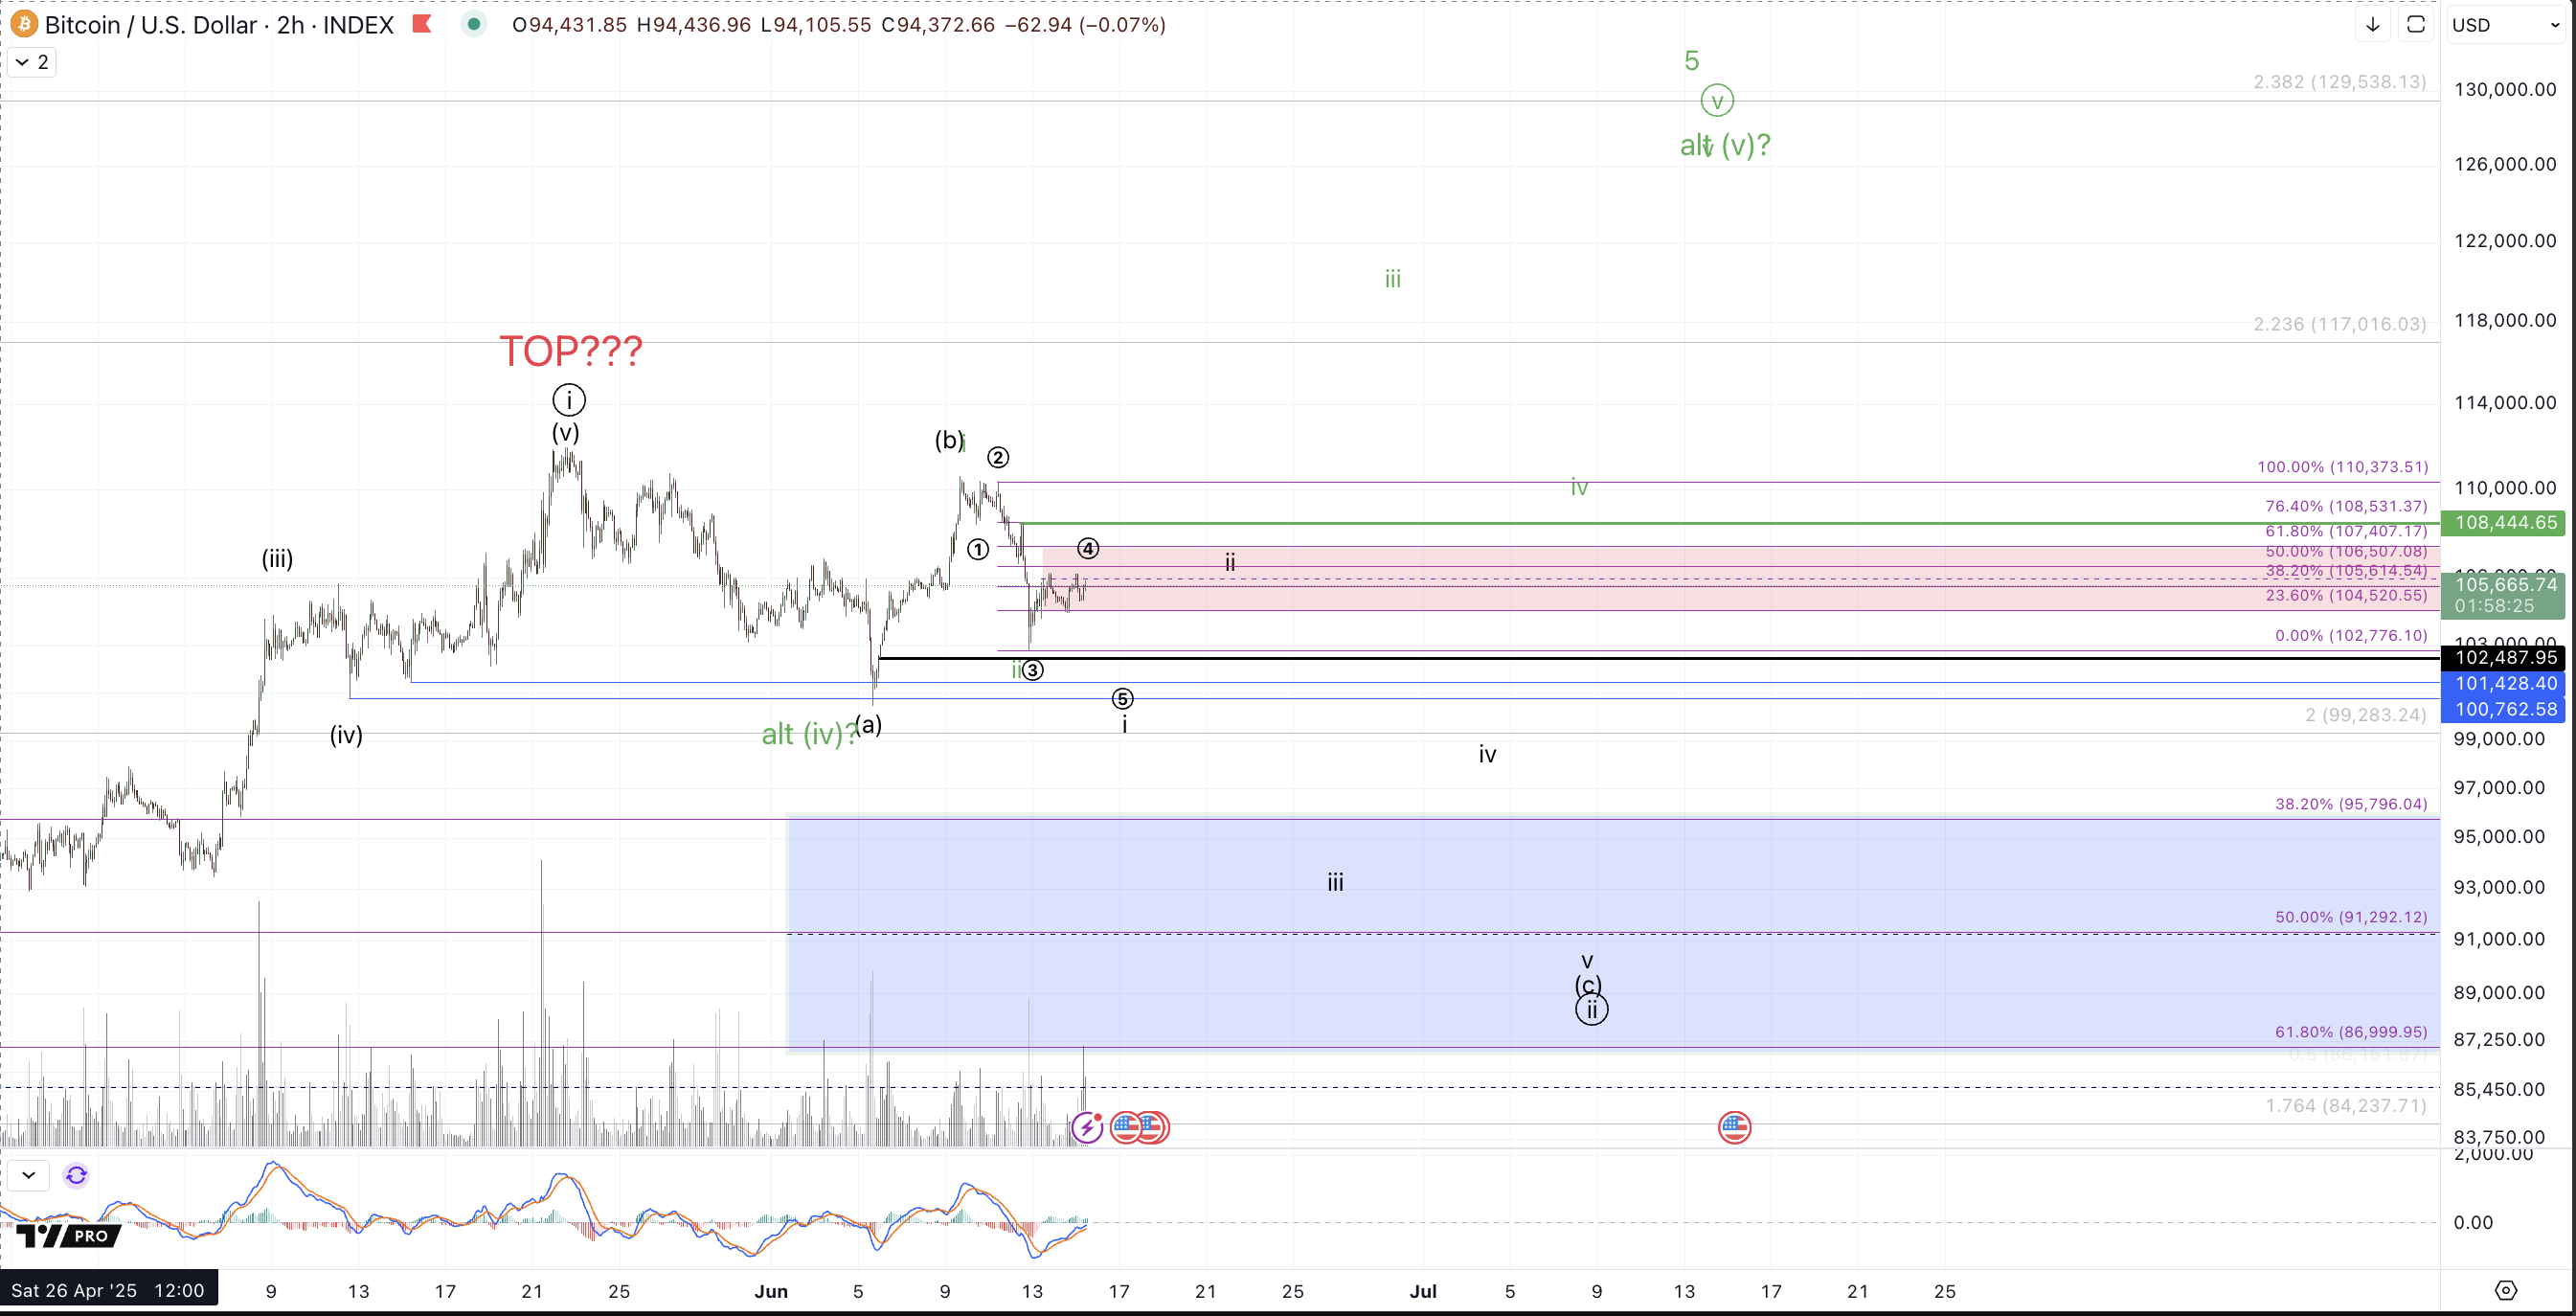
Price is right back to the same location it was as of the last article, virtually unchanged, currently printing at less than 0.5% since gain June 4th. Bitcoin initially got a successful test of the upper support mentioned in that article, $99k-$105k, finding a bottom on June 5th at $100.4k and making a v-shaped recovery into last week's high struck on June 9th at $110,6k. In narrative terms this is exactly what we were looking for as a start to the wave (v) up to reach the larger $125k target. However, the internal wave structure off the 6/5 low was a clear 3 wave move.
Until Thursday of last week, I was giving the immediate bullish case the benefit of the doubt, considering a possible i-ii, 1-2 setup from the the June low, getting ready for a potential blastoff, provided that the Sunday, June 8th low held. Thursday's breakdown, roiled this potential plunging price all the way down to the .764 retrace of the entire V-shaped bounce from the 6/5 low.
Where does this leave us?
As of writing this article, the immediate bullish case for a direct move to $125k without a retest of the June low is still valid albeit rather unhealthy. Considering that the bounce from the June low was 3 waves with a pullback to the .764 retrace, the only remaining structural potential for the immediate bull case is an ending diagonal shown in green on the 2h chart. This is a lower confidence pattern and while technically valid so long as this the 6/5 low holds the bounce from the 6/12 low looks rather anemic and has yet to clear any resistance.
The other bullish potential discussed in the June 4th article (shown in blue in that post) outlined a path where price could find a bottom in upper support, get a bounce up to $110k and then test lower support, $87k-$96k. Considering the action over the past 10 days, this appears the highest likelihood path at this time considering that so far it's a near perfect navigation of the aforementioned path.
In order for this to path to gain in probability, we'll want to see a clear micro 5 waves down from the 6/9 high (as shown with circle 1-2-3-4-5 in the black count on the 2h chart) and subsequent micro 3 waves bounce for a i-ii down, and / or a break through the 6/12 low, the latter of which would invalidate the remnants of the green immediate bullish setup. At that point, we have even stronger confidence of further decline coming to take price into lower support, ideally towards the lower end of that support in the $87k-$90k region.
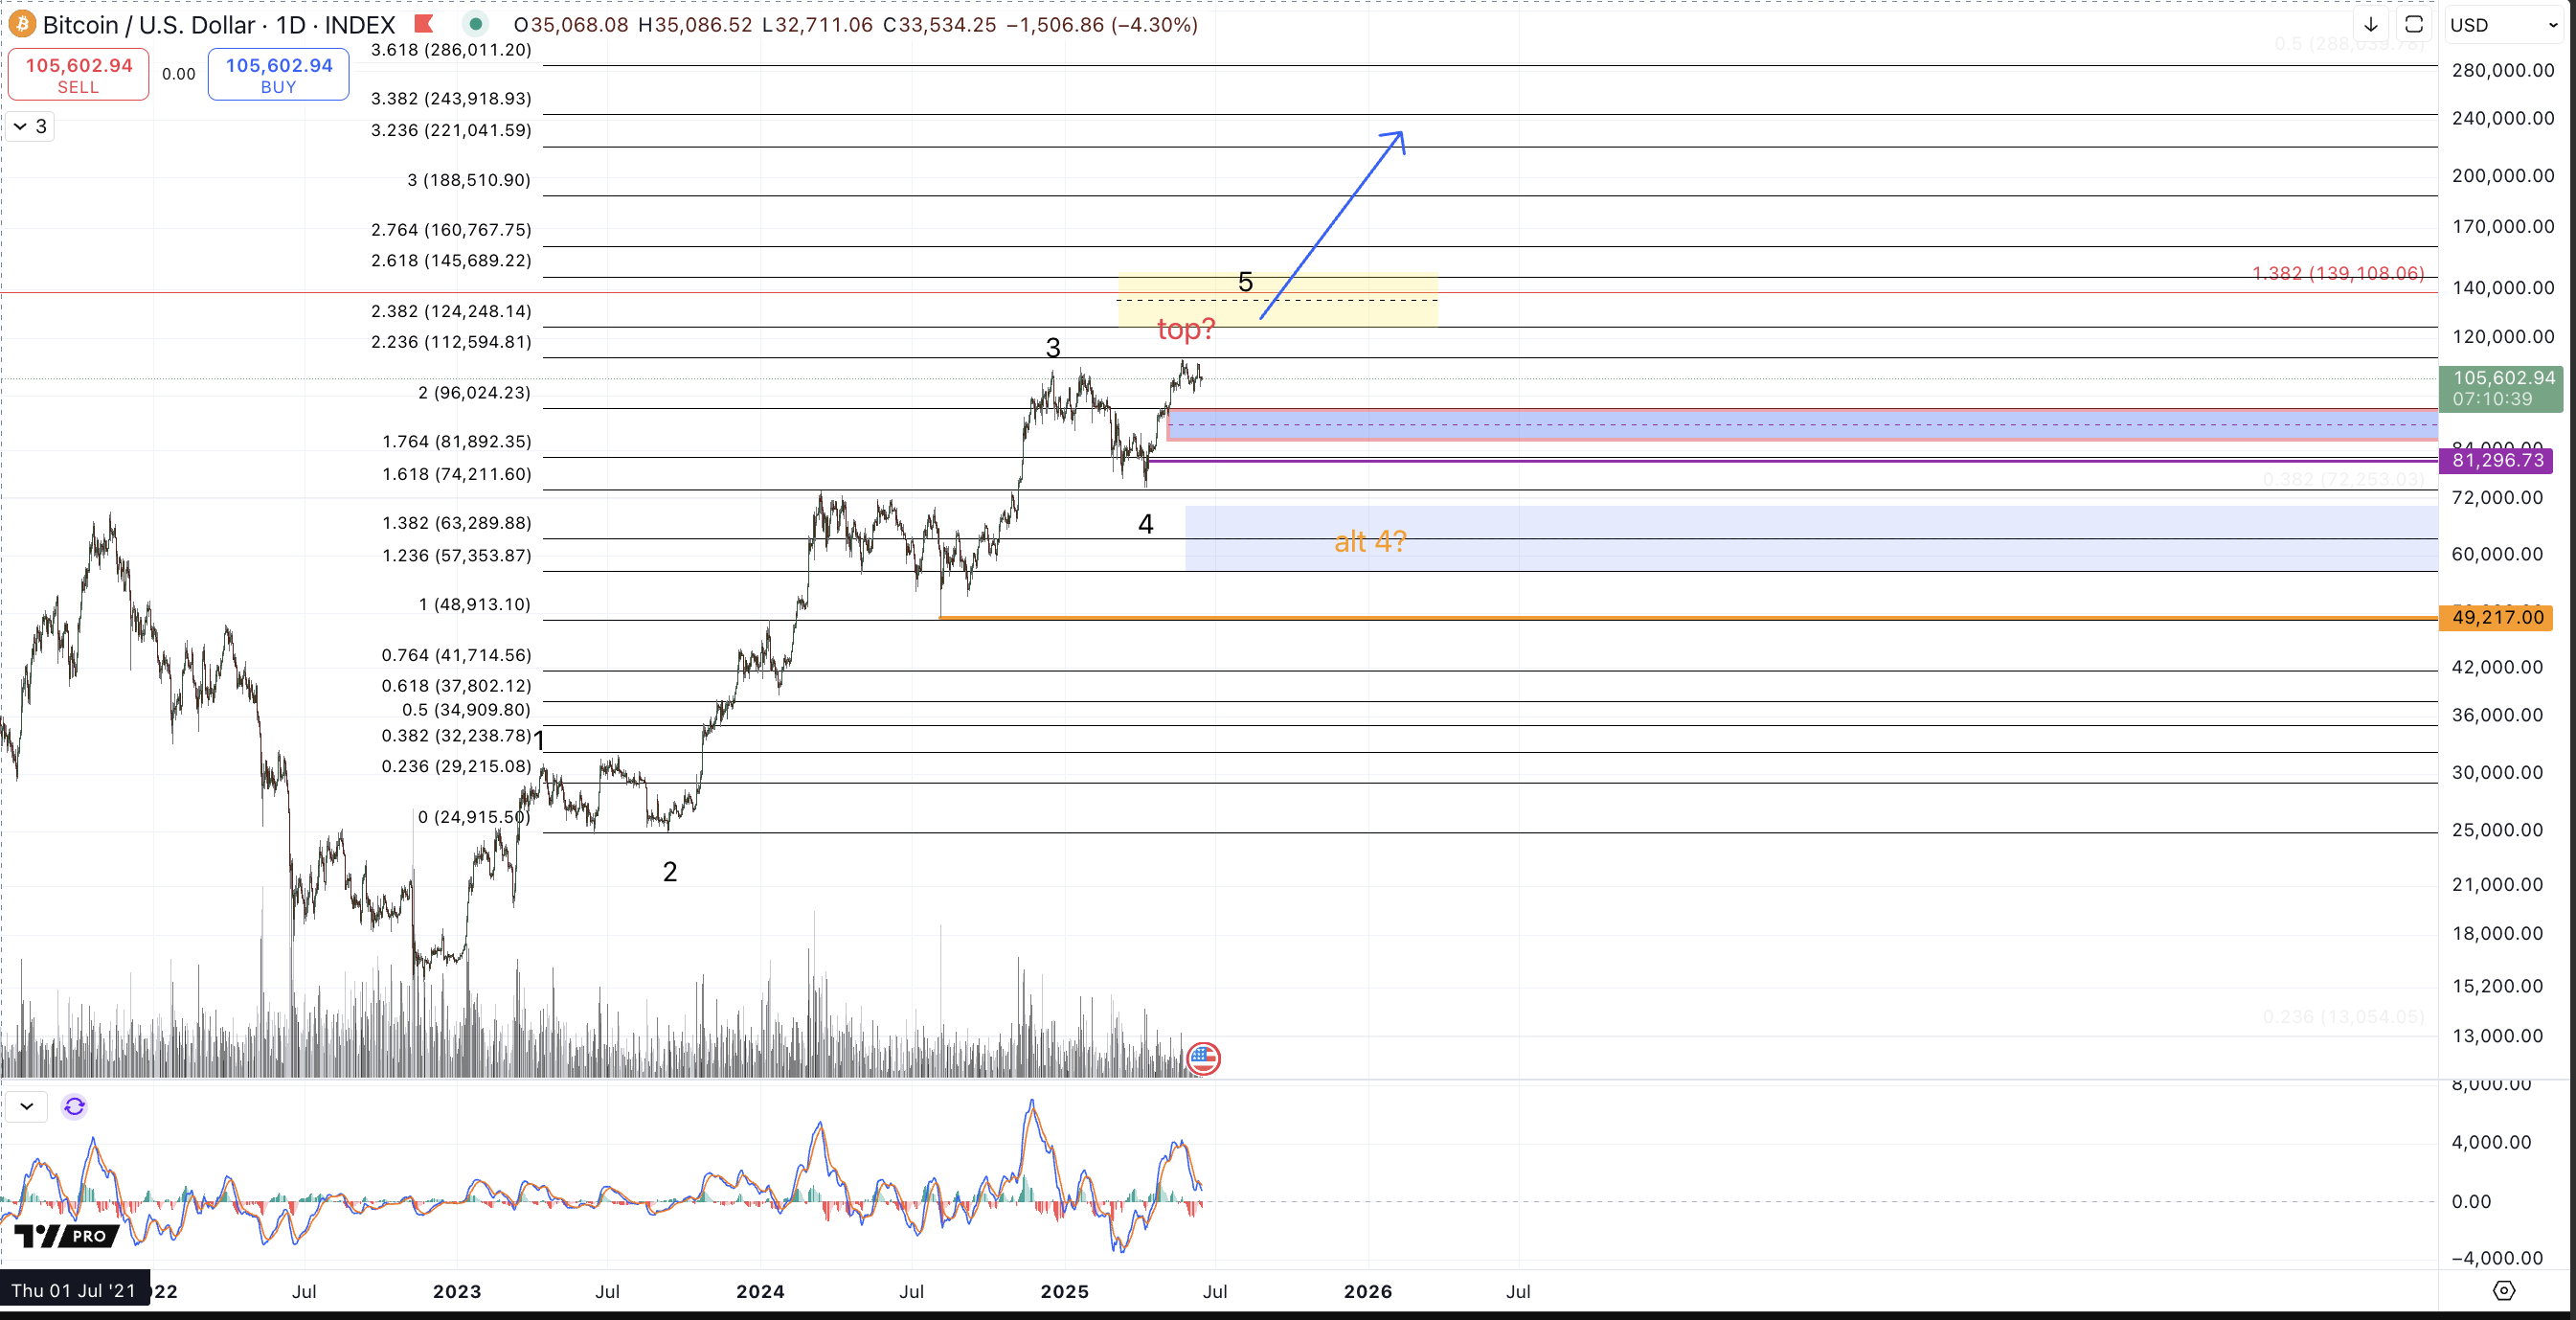
Should the upcoming week bring price down into the noted zone, $87k-$96k, this pull back can be viewed tentatively as an opportunity to accumulate more longs for the next run into new all-time highs targeting minimally $125k. Please note that my bigger bullish perspective that was outlined in the 6/4 article in blue count entails a very bullish move from the $87k-$96k given the potential circle i-ii interpretation from the April low now shown in black to indicate its primary status. "Support for this perspective is $87k-$96k and a successful test of this region could launch Bitcoin much higher, into $250k+ for a big 5th wave to complete the cycle from 2022." However, there are a few reasonable variations of my wave count interpretation from the August 2024 and April 2025 lows that strike confluence around the long term $125k-$140k target. Assuming a successful test of support in the coming week followed by new all-time highs, we can closely follow "must-hold" support levels to retain the more bullish and favored prospect of BTC attaining $200k+ in this cycle but at a minimum, a successful test of support should likely propel price up to $125k-$140k.
What if $87k breaks?
Technical invalidation of further upside from the April low requires a break of that low which was struck in the $74k region. Clearly we'll want to see standard Fibonacci support hold ($87k-$96k) but I would certainly allow for a bit of overthrow before jettisoning the bullish thesis. Bitcoin trading back below the 4/21 low, $85k~, starts to become cause for concern, and concerns increase with should price break below $82k (the .764 retrace). Specifically, I'm watching the $81.3k level, which is an untested hourly low in the rally up from early April. So, below $85k is a warning shot of the potential that a much larger degree top might have been struck and below $81.3k signals likely impending invalidation of further bullish continuation up from April.
Please keep in mind that this cycle from the 2022 low has rallied as much as 624%, trough to peak, (so far) and has what can count as a complete 5 waves up. This larger degree posture outlined in the 6/4 article should be considered regarding the overall risk and that in a larger sense we would be wise to prepare for a more significant top and subsequent bear market.